Histograms are the solution to a fundamental problem in photography: Our eyes don’t always tell the truth. Have you ever been in a dark room, turned on your phone, and felt it blind you like nobody’s business? The same thing can happen in photography. Several times, I’ve taken pictures at night, and they look great on my camera’s LCD — until I open them the next day on my computer and realize they’re all hopelessly underexposed. Enter the histogram. This is one of the best ways to know exactly, mathematically, the brightness of your pixels. So, let’s dive in.
Table of Contents
1. What are Histograms?
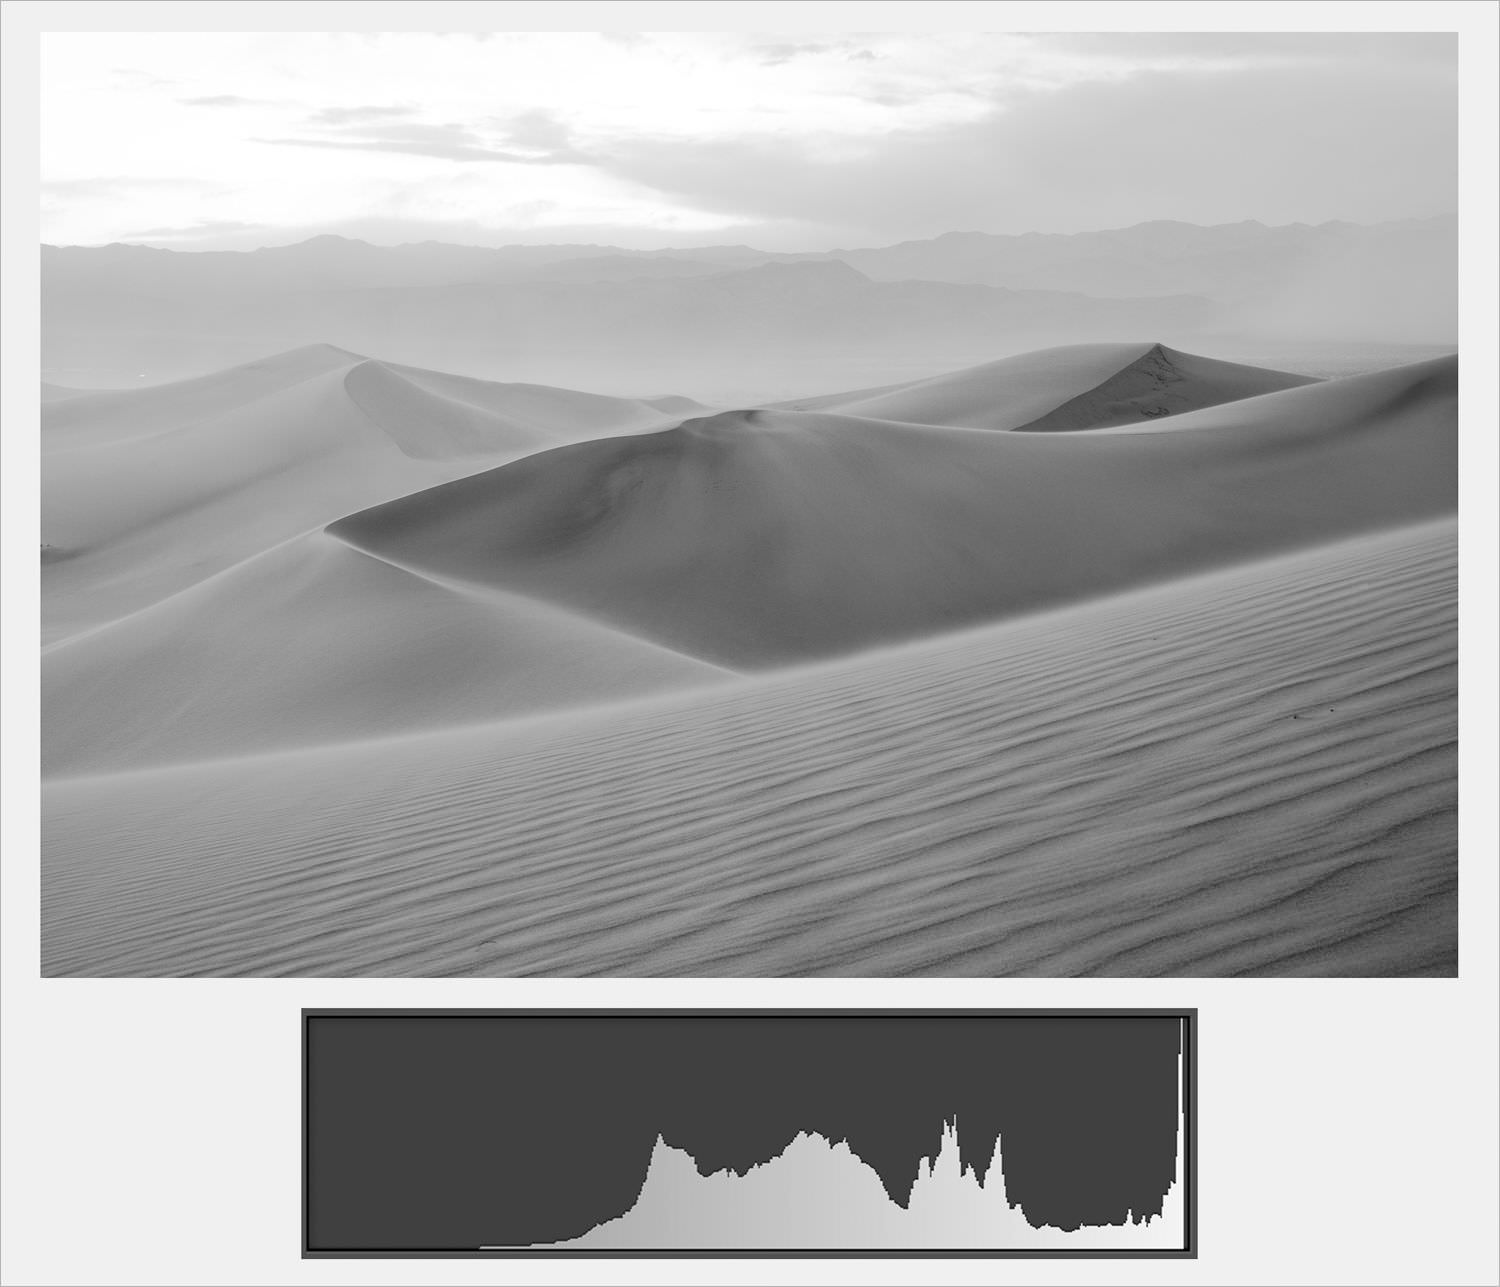
Histograms are graphs of your camera’s pixels that specifically show brightness. This is quite useful. You don’t need to rely on your eyes to tell the brightness of a photo; you can get a more objective understanding by looking at a histogram. Here’s a sample photo paired with its histogram:
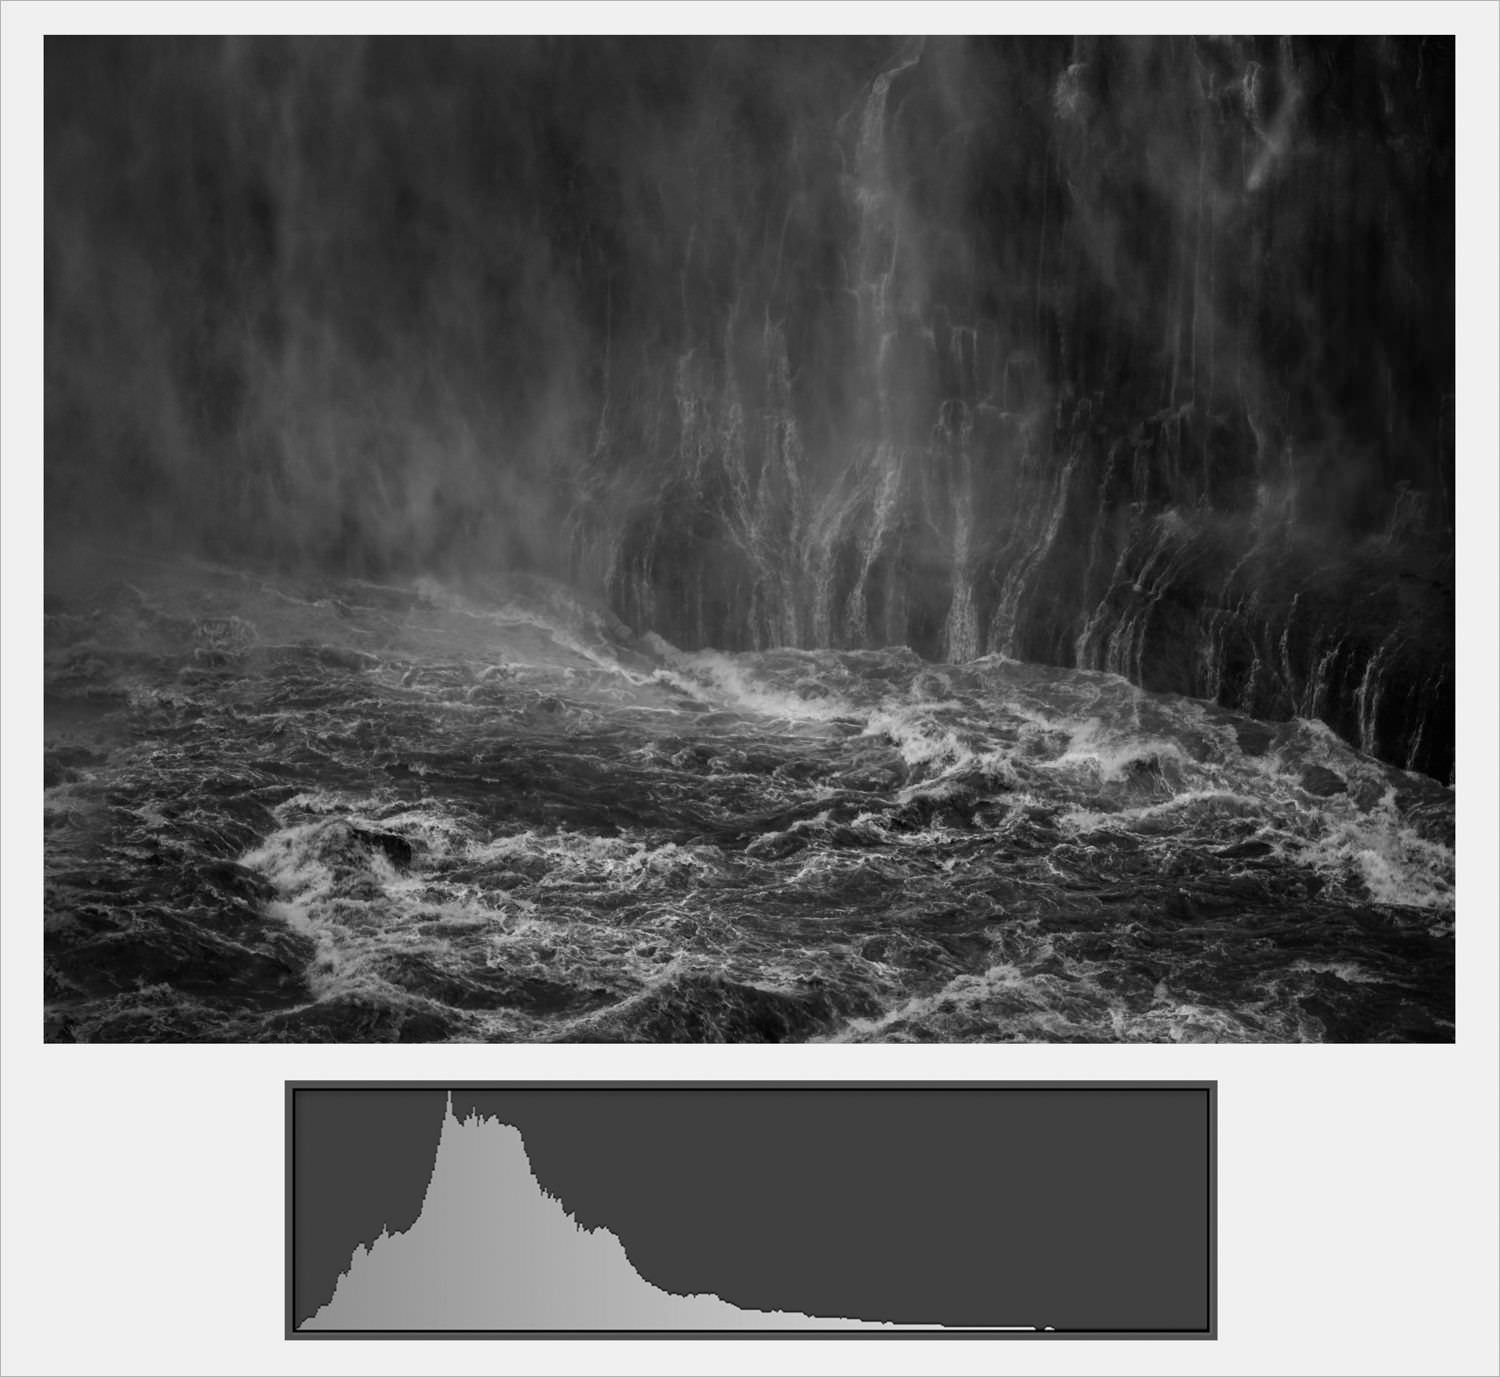
As you can see, the photo above is very dark. The histogram underneath it, too, is shifted mainly to the left. That’s not a coincidence. Here’s another example:
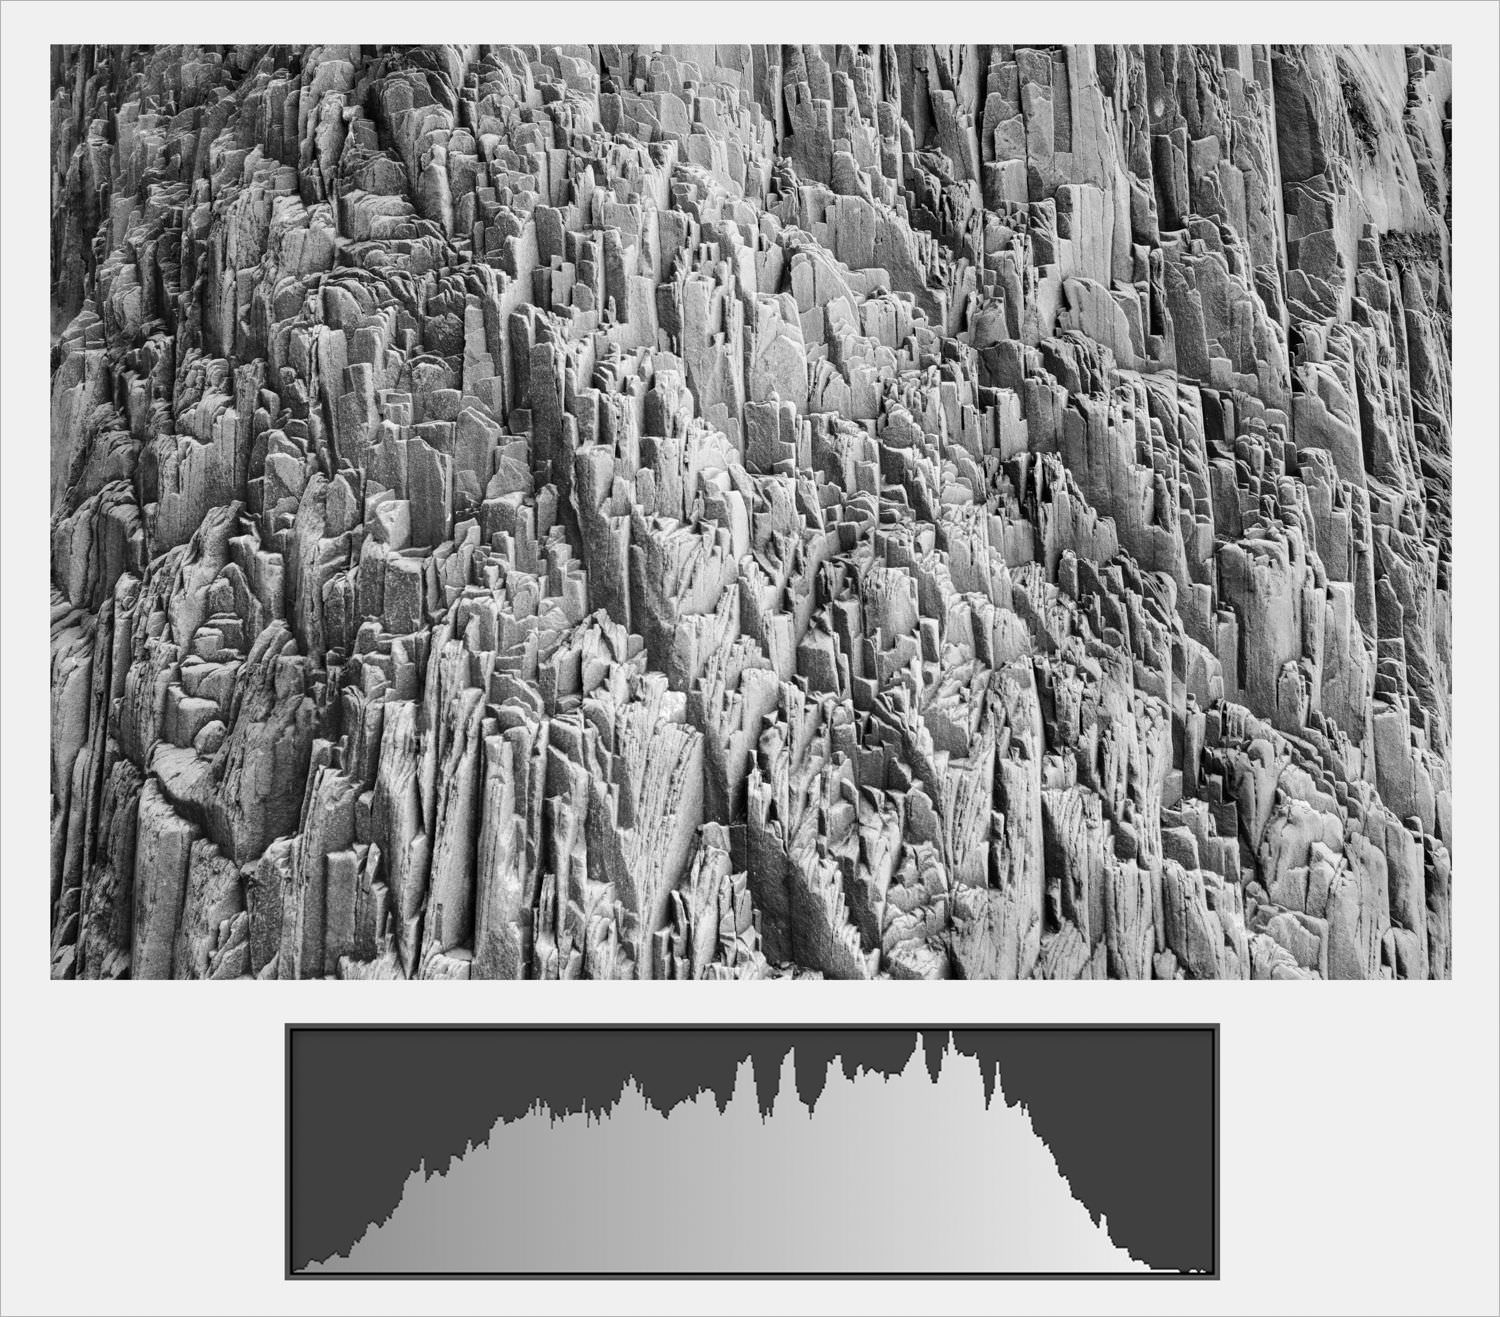
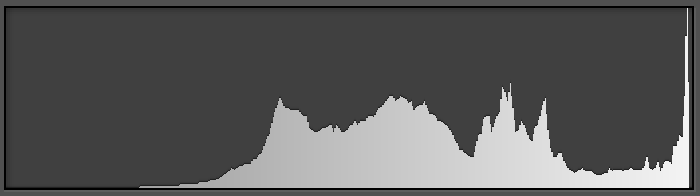
The photograph above is neither dark nor bright; it’s somewhere in the middle. In other words, a majority of the pixels in the image above are simply “normal” in brightness — and the histogram is roughly centered.
Here’s the last example:
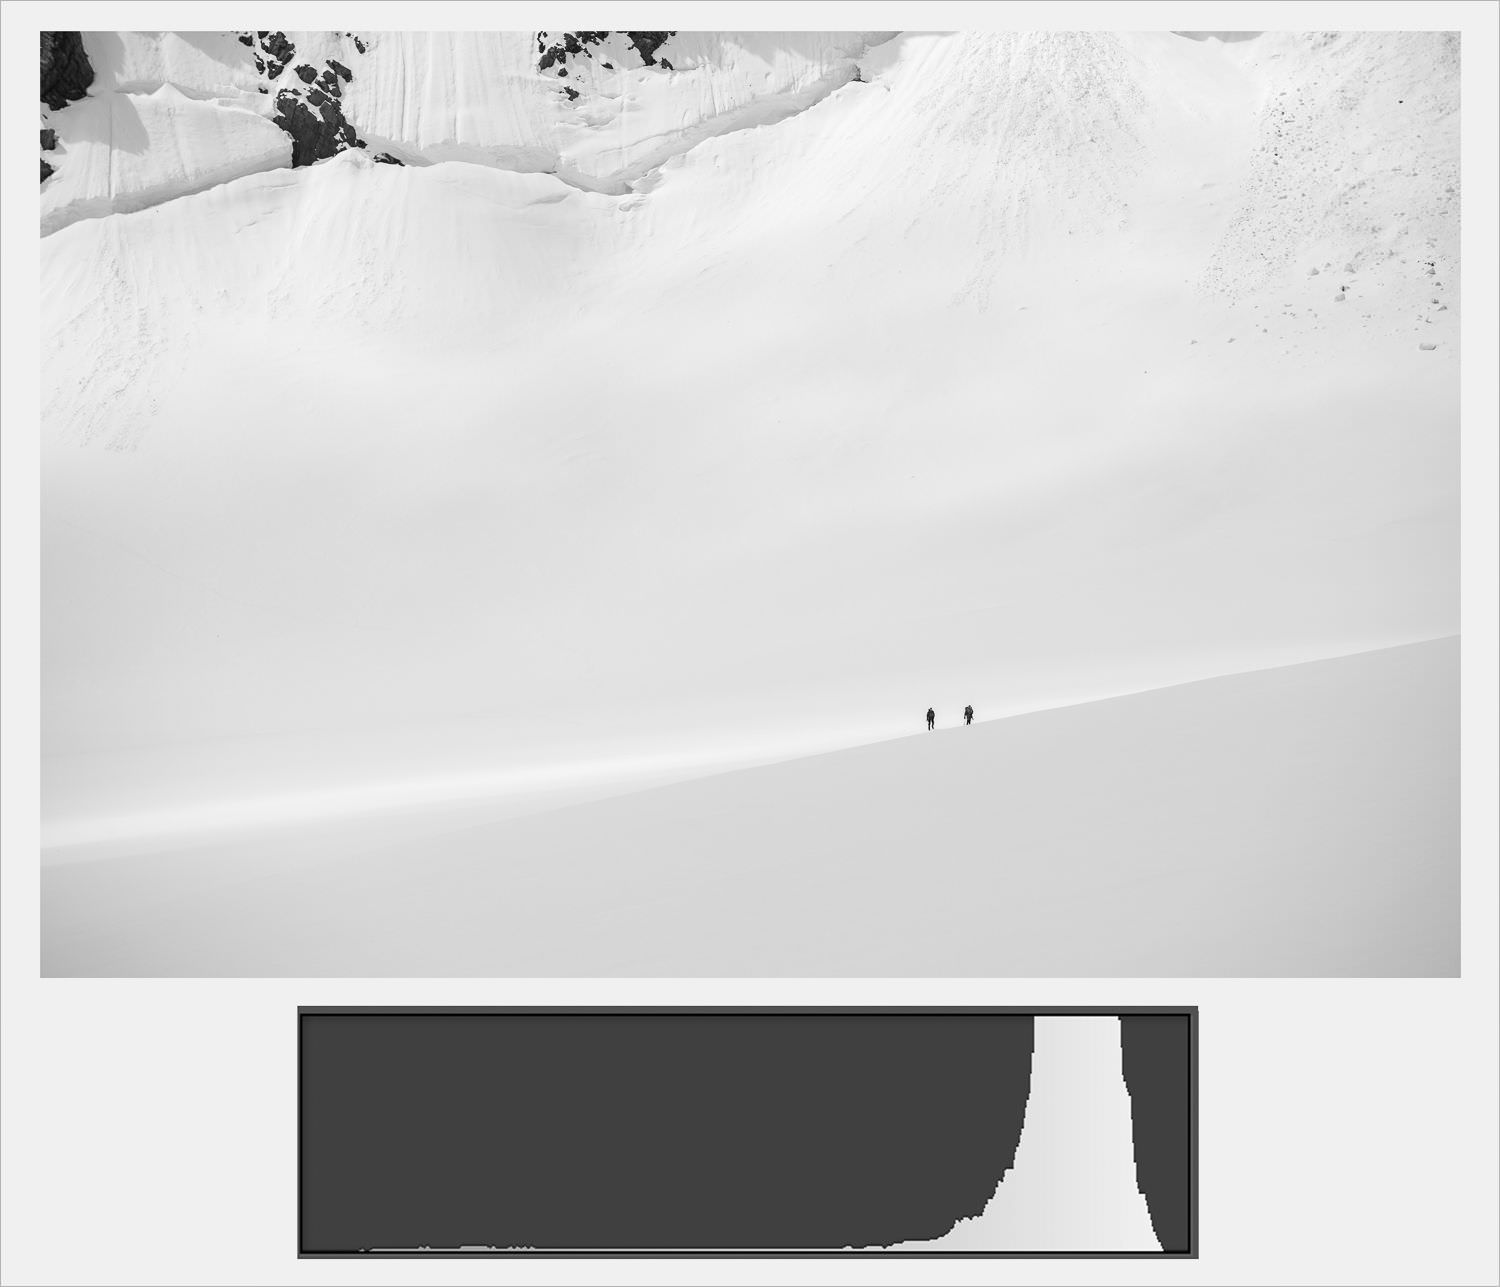
In this photo, which is clearly much brighter, the histogram is bunched much closer to the right. Are things starting to make sense? Here’s our tally so far:
- Dark photo: Leftward histogram
- Bright photo: Rightward histogram
- Medium photo: Centered histogram
Essentially, a histogram’s layout is like this:
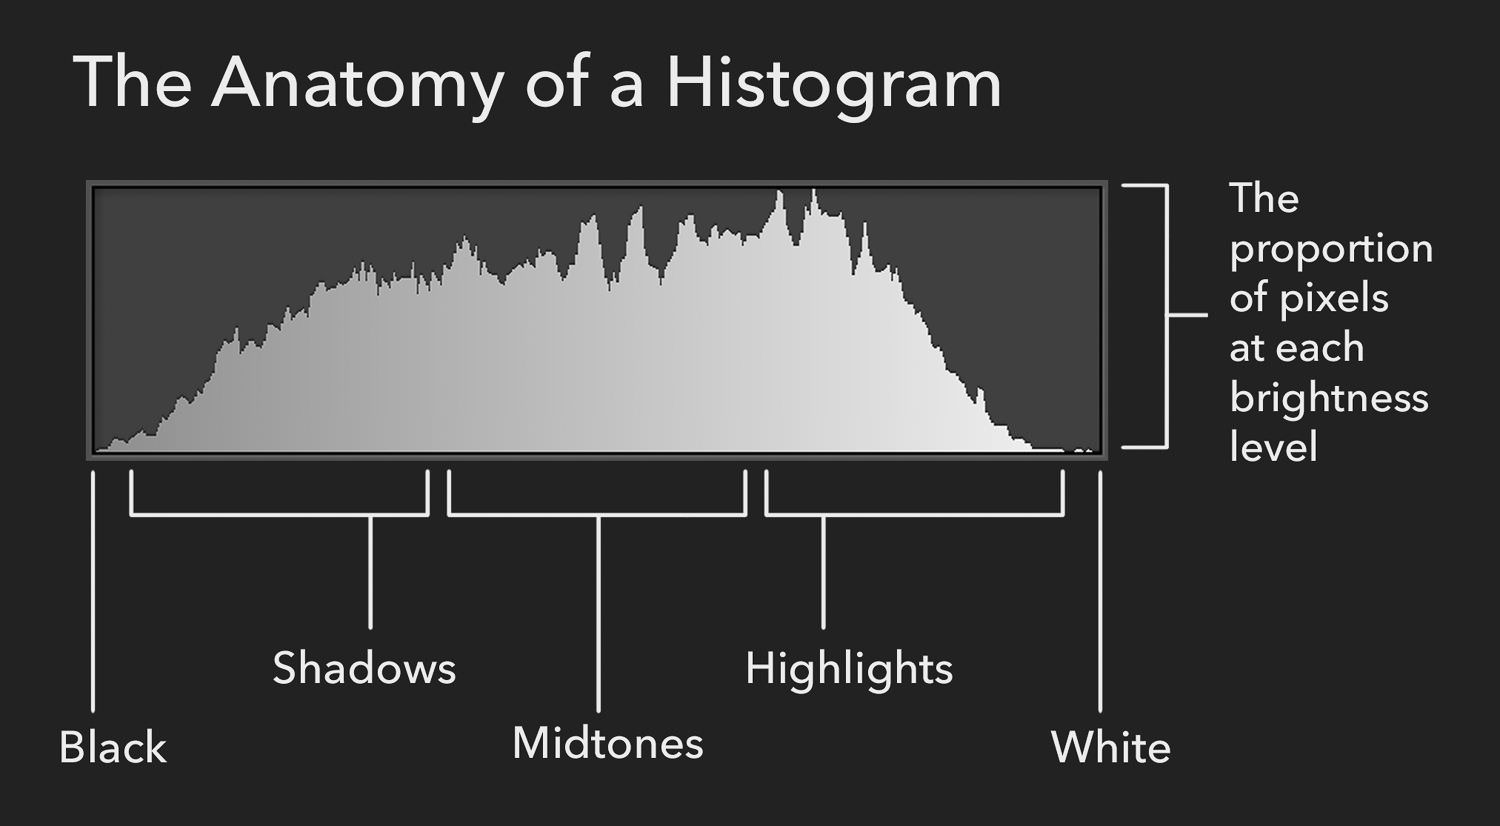
So, histograms are a graph of the brightness of each pixel in your photo, arranged from dark to light. They are a useful way to visualize how bright your photo is in an objective way. Also, you’ve probably noticed that all the photos so far are black-and-white. That’s because color histograms have a bit more information, and they take some extra effort to understand (although they’re still pretty easy, as I’ll cover in a moment).
2. Why Do Histograms Matter?
Aside from what I’ve already suggested — that histograms help you out in dark conditions — there are a few other reasons why histograms matter. Most importantly, this is one of the best ways to figure out if you’ve lost any detail in the highlights or shadows of an image.
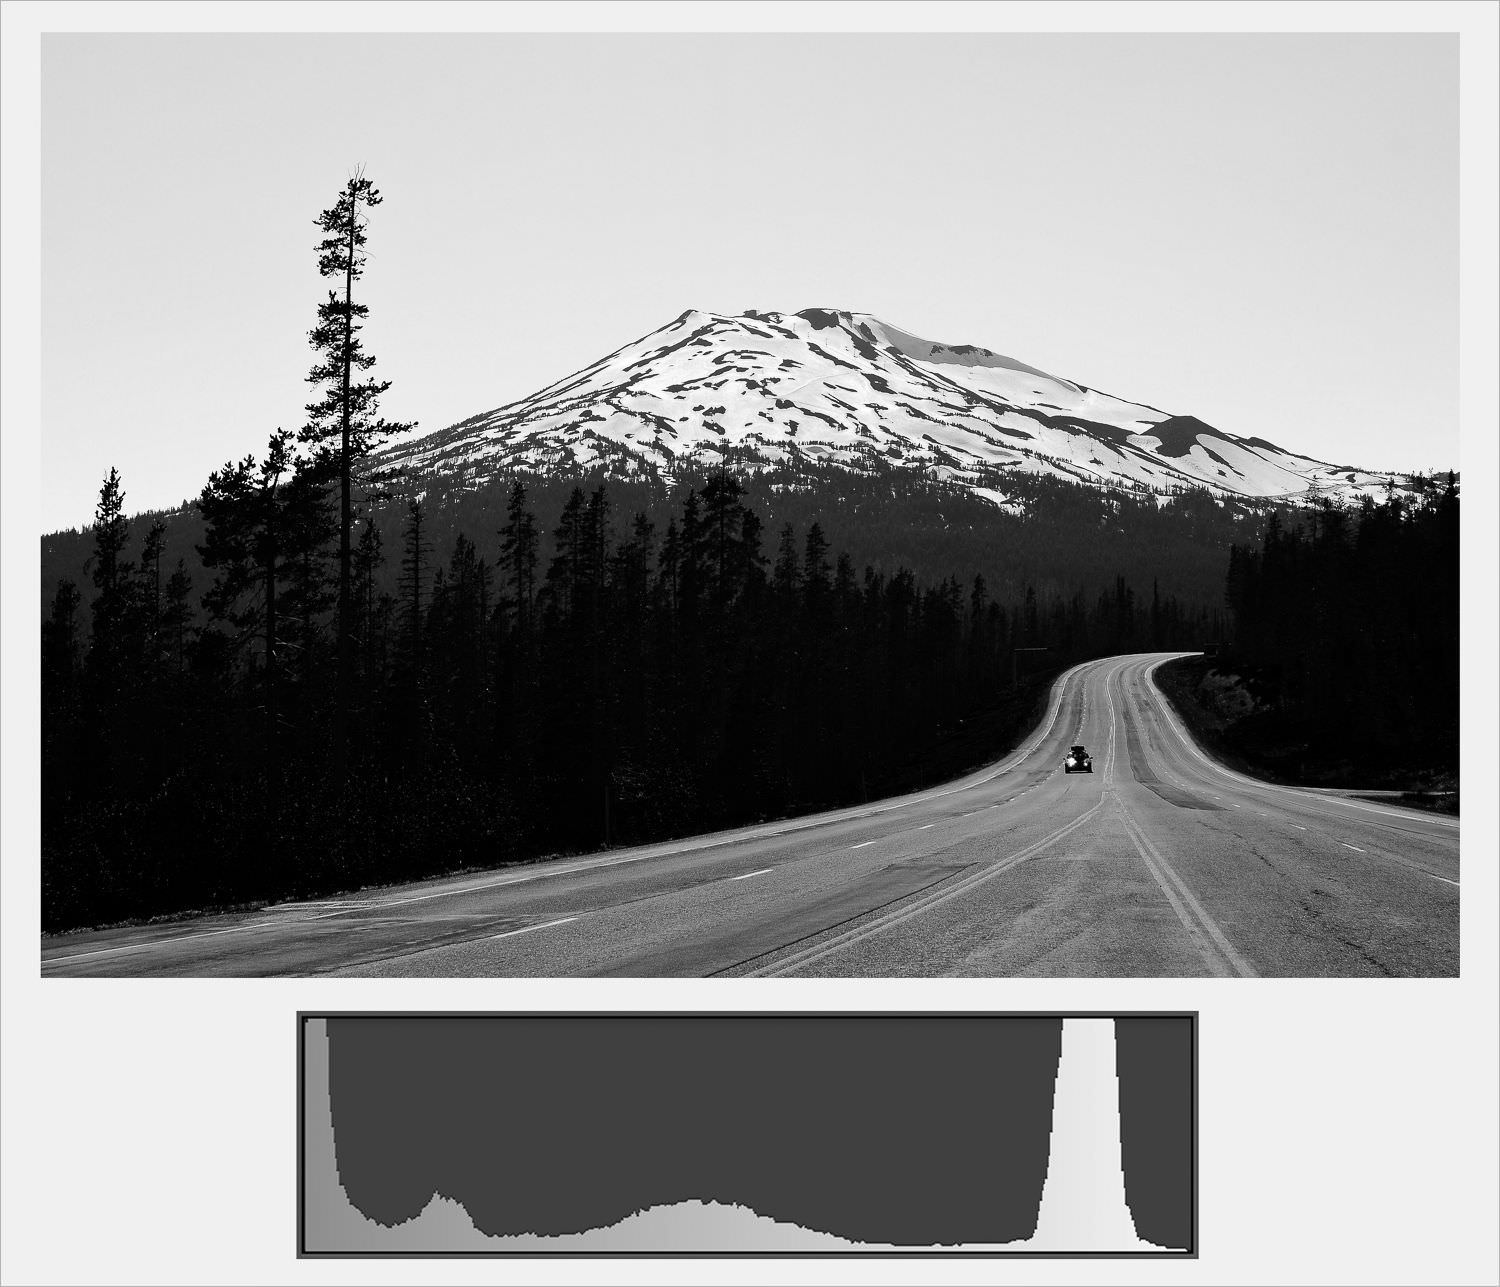
It’s a simple concept: When there are pixels all the way to one side of the histogram or another, black or white, you’ve lost some of the information in your photo. For example, in the image below, you can tell that I’ve lost details in the highlights, since the histogram has a tall column on the very right:
The same goes for this photo, which has regions that are totally black:
When you’re out taking pictures, and you don’t know whether you’ve lost important details, the histogram is a great place to start. Any time that part of the histogram is touching the very far extreme, you’ve potentially lost detail in that region. Personally, I use histograms all the time to make sure that I’m exposing properly, and especially to make sure that I’m not overexposing an image. (Overexposed areas of pure white are impossible to recover, while it’s usually possible to bring back shadow areas even when they look almost completely black.)
3. How to Use Histograms
It’s very easy to use histograms properly. In fact, you don’t need to look at most of the histogram.
Focus your attention only on the right-hand side of the histogram, where the bright tones appear. Ask yourself if anything is overexposed (which would appear as a column touching the right-hand side). For example, this histogram comes from the sand dunes photo above:
You can tell from this histogram that the photo is overexposed. You don’t even need to look at the image itself to realize that. Because of the tall column up against the right-hand side, you can deduce that certain parts of the image are completely white. Not good.
Having a column on the very righthand side isn’t always a problem. For example, if the sun is in your photo, it should be completely white in the center. However, tread carefully. In most cases, it’s something to avoid, especially if more than a small handful of pixels are completely overexposed.
Side note:
Your pixels have to be completely white before it’s impossible to recover highlight detail. Normal highlight regions? They’re perfectly fine and easy to recover, so long as nothing is 100% white.
The most important thing is to avoid blowing out any highlights. If you make that mistake, there’s no easy post-processing fix. That’s why I like histograms so much — they make it easy to know for sure if any highlight detail in an image is gone.
4. Understanding Color Histograms
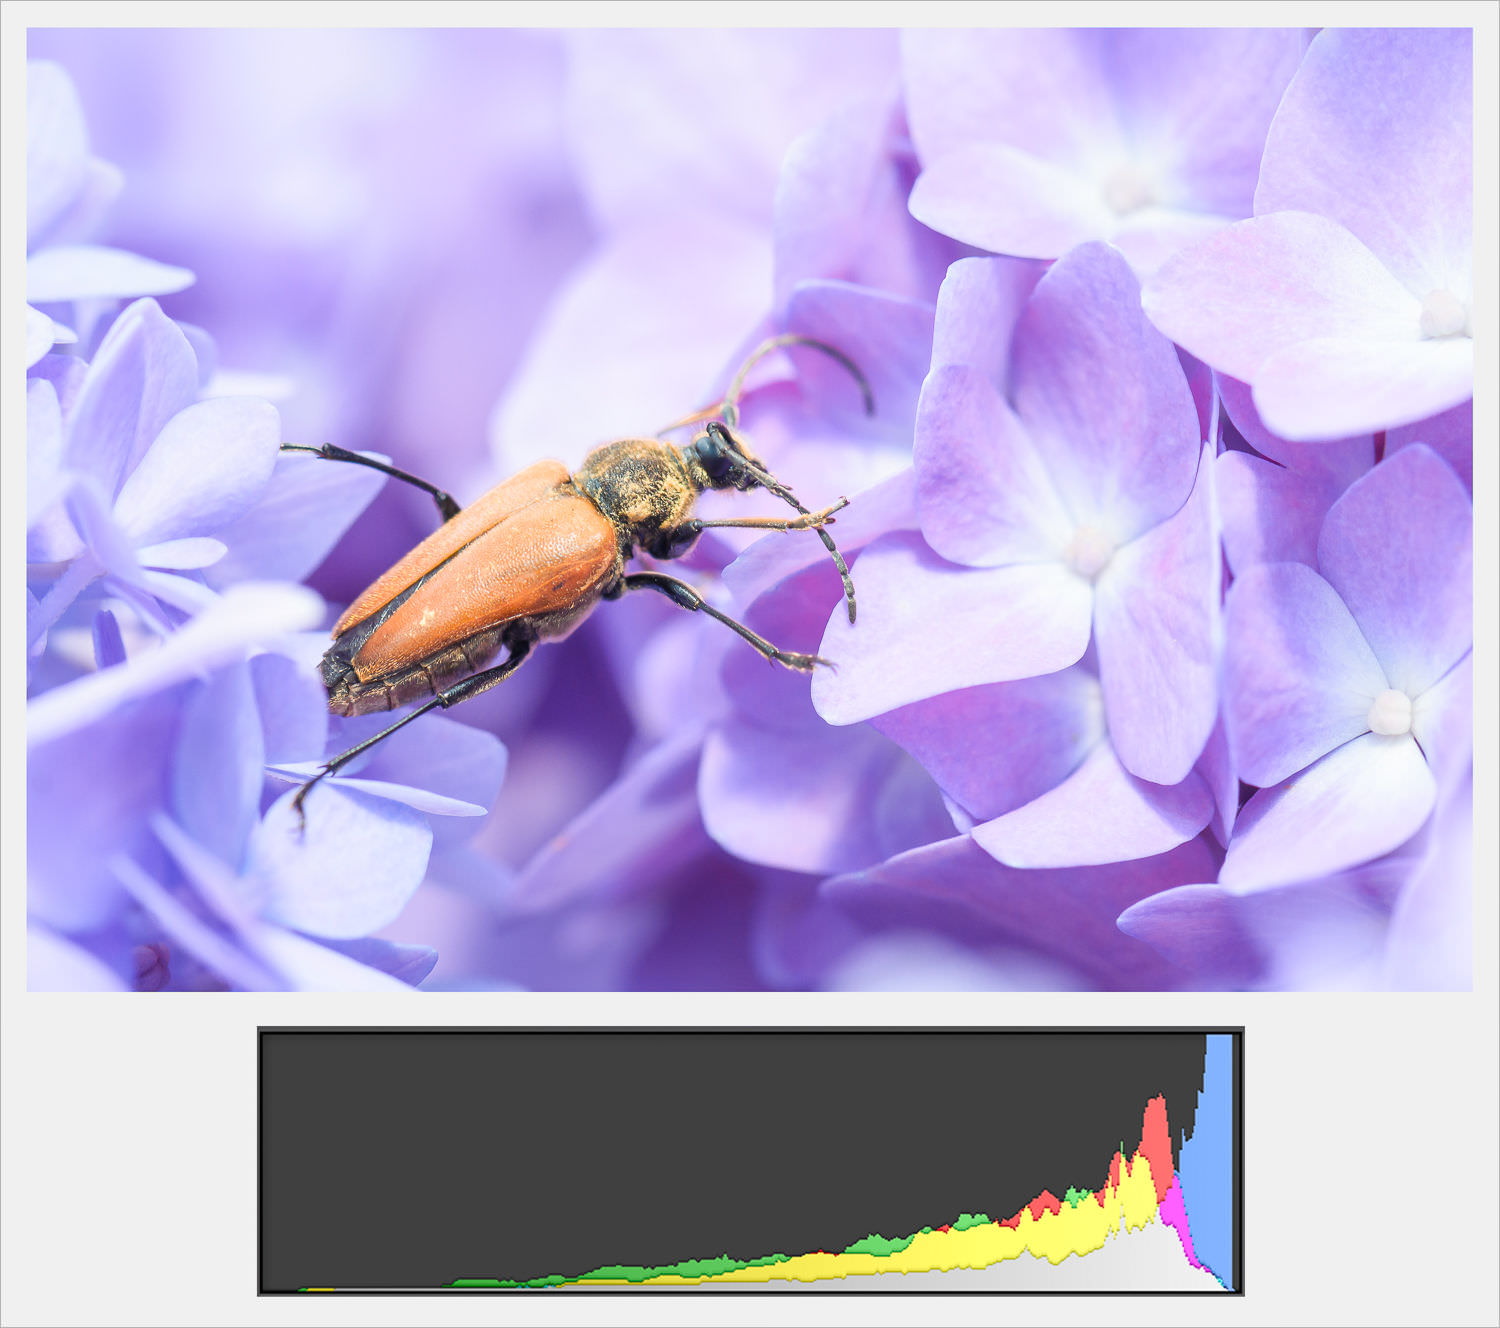
The histograms I’ve shown so far are accurate, but they’re only for black and white images. In color photography, histograms get a bit more complex. That’s because your camera sensor has red, green, and blue photosites within every pixel. So, naturally, a color histogram has red, green, and blue components. Here’s an example photo paired with the histogram:
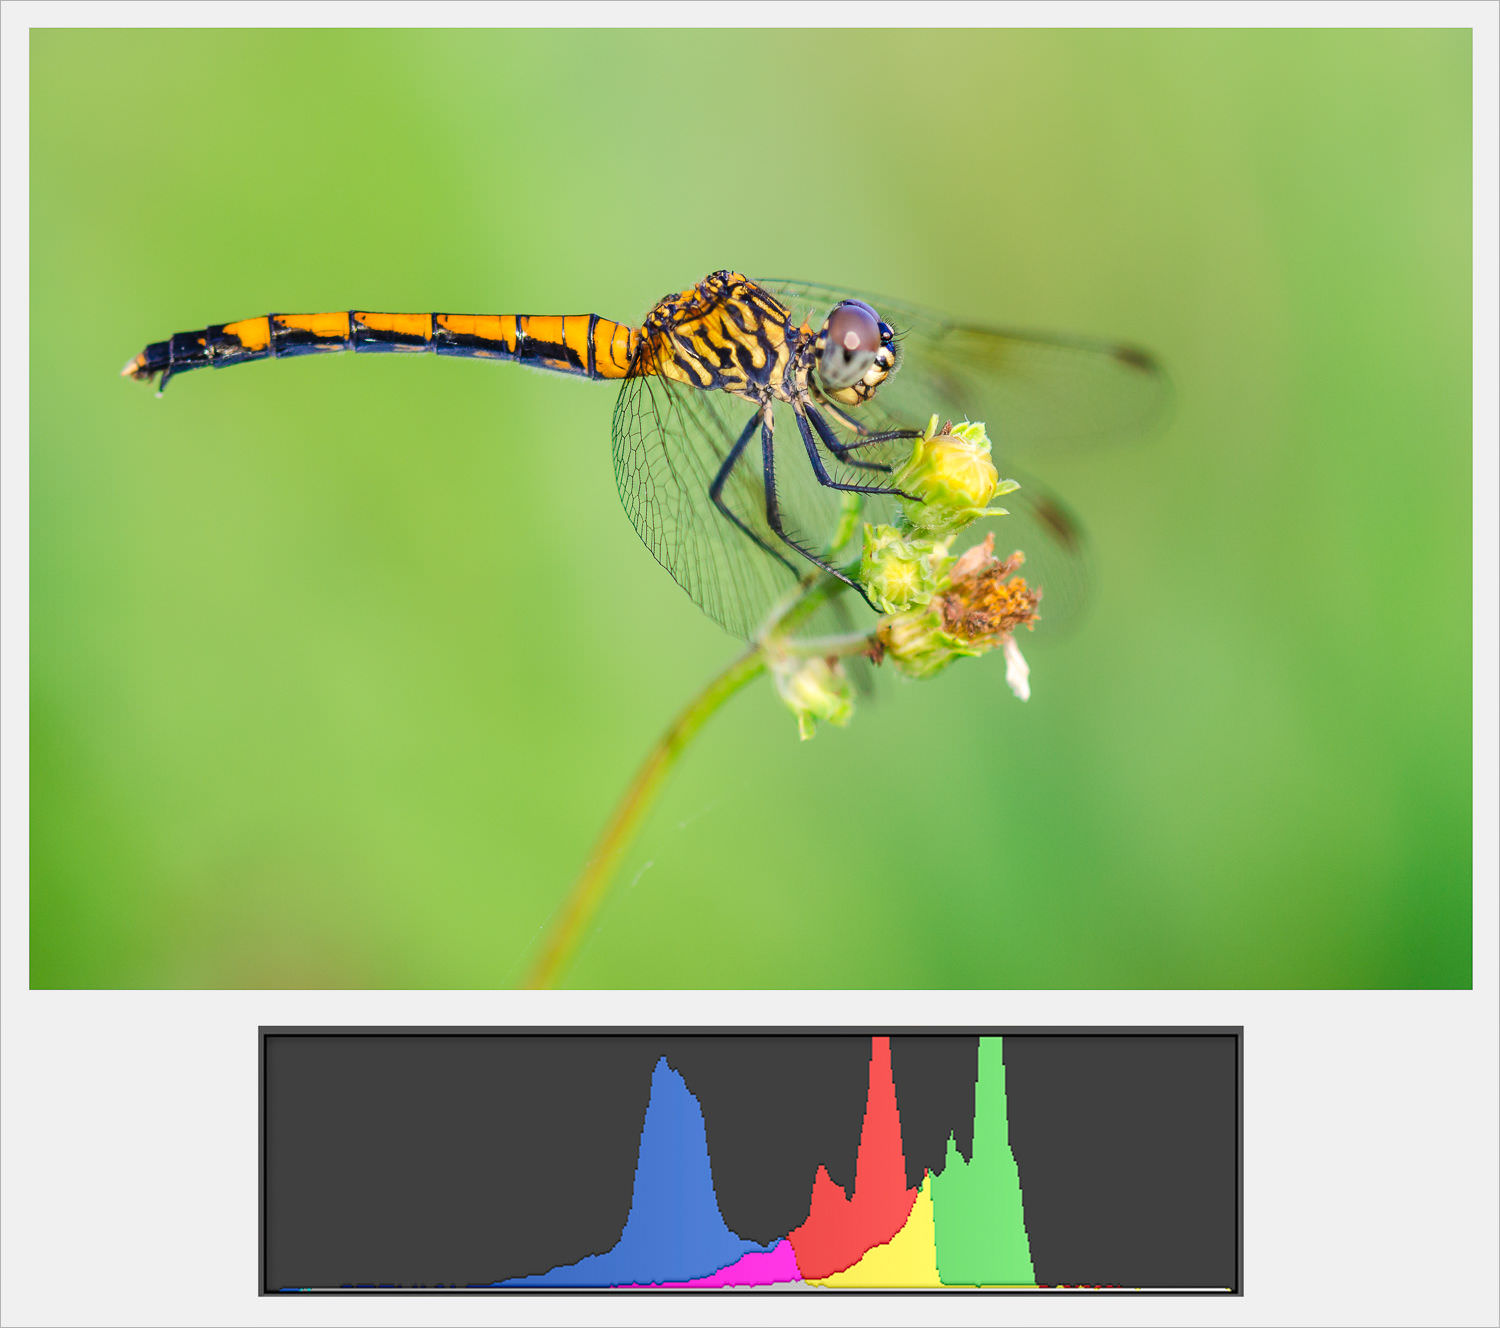
This leads to an interesting result: You can lose information in one color without losing information in the others. For example, you might have a very bright photo where some of the blue channel is overexposed, but the red channel and green channel are fine, like the image below. Is that a problem?
Yes, that is a problem! It means you’ll be able to recover some highlight information, but the colors in your highlights won’t look quite right when you do. They’ll shift in strange directions, because you’ve lost a lot of blue information.
Overexposing just one of the three color channels is nearly as bad as overexposing all of them.
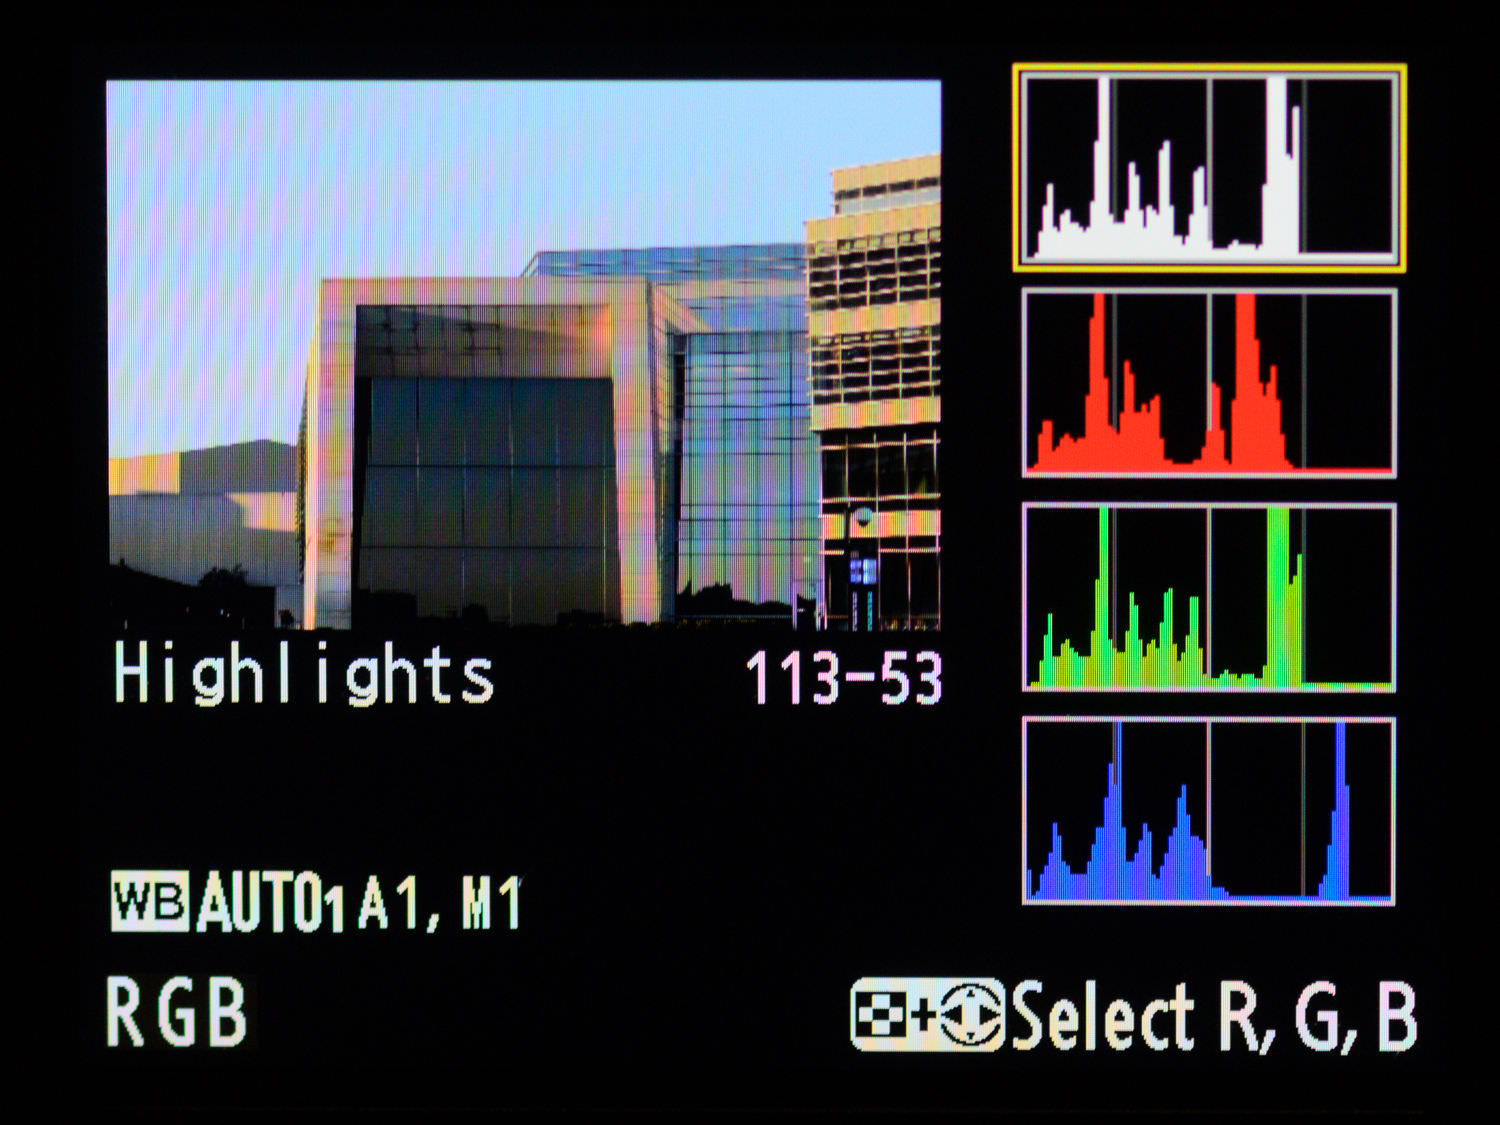
Luckily, most cameras let you see all the color histograms at once, so you aren’t flying blind. You’ll want to enable this feature (otherwise, the camera might just show a monochromatic histogram by default, which isn’t very precise). For example, on my Nikon DSLR, I’m able to see this screen when reviewing an image:
5. How to Enable the Histogram in Your Camera
Hopefully, you agree that it’s a good idea to enable the color histogram in your camera. How do you do that? It varies:
- On most Nikon cameras, go to Menu > Playback icon > Playback display options > RGB histogram. Then, when you’re reviewing a photo, press the “up” button on the direction pad multiple times to cycle through different displays.
- On most Canon cameras, go to Menu > Playback icon > Histogram display > Brightness/RBG > RGB. Then, when you’re reviewing a photo, press the “Info” button multiple times to cycle through the different displays.
- On most Sony cameras, go to Menu > Gear icon > DISP Button > Histogram. Then, when you’re reviewing a photo, press the DISP button to cycle through different displays (or the “up” button on the direction pad if your camera doesn’t have a DISP button).
However, every camera is different. If you have a camera from another manufacturer, the process won’t be exactly the same. Even if you do have a Nikon, Canon, or Sony camera, your exact model might have some differences. When in doubt, consult your user manual. Or, just search for the answer online.
6) An alternative to the histogram
Histograms aren’t the only tool for this job. There are also blinkies, which make overexposed regions of a photo blink black and white upon review.
Blinkies aren’t always as good as histograms — specifically, they don’t tell you about individual color channels — but a lot of people find them easier to understand. They also do a good job showing exactly where any overexposure occurs.
If your camera has this option, it’ll be under the same menu as the histogram setting. This is called “Highlights” for Nikon and “Highlight alert” for Canon. For Sony, they’re automatically on once you enable the histogram.
7. A Note on the JPEG Histogram
A discussion on histograms (or blinkies) isn’t complete without mentioning one corollary: As helpful as they are, they typically don’t reflect the complete set of RAW data that most cameras can capture. In other words, it’s possible that your histogram or blinkies say that a highlight is blown out, but you actually can recover the data without issue — sometimes just barely — in post-processing software like Photoshop or Lightroom.
The reason is that cameras display the histogram based upon your camera’s JPEG settings, even when you’re shooting RAW files. (Check out our intro to RAW vs JPEG, and why you should shoot RAW.) So, if your JPEG settings include extreme contrast and vibrant colors, your histogram may say that you’ve overexposed a highlight long before you’ve actually lost data in the RAW file.
For most photographers, my recommendation is simply to leave your JPEG settings — called Picture Control settings, Creative Style settings, etc. — set to “boring” values that don’t add much contrast or saturation. Personally, I just use Camera Standard with contrast and saturation set to zero.
Side Note:
If you really want the most accurate possible color histogram, you can go much deeper than these basic changes, including setting your Picture Control to the flattest possible version, lowering contrast as much as possible, and using a specific “UniWB” white balance for all your photos (which will make them appear very green on the back of your LCD screen). These steps are overkill for most photographers, who just use histograms as a basic guide to avoid overexposure. It’s also beyond the scope of this article — but if you’re a histogram maniac, it could be worth exploring.
8. Conclusion
It’s a simple fact that you can’t trust your eyes to be perfectly accurate. You can’t trust the camera’s LCD, either — and with histograms, you don’t need to. The only important thing is to know how to read them. Once you understand how to read a histogram, you’ll be at a huge advantage in photography. You won’t end up overexposing or underexposing an image by accident, since you’ll already know how bright it is.
Personally, I use histograms a lot (and blinkies, too). The same is true for almost every photographer I know. They’re a great tool, and one that is worth learning how to use properly.
Bottom Line: I am just a knuckle dragging photographer (D850) and I follow two basic Histogram rules. Far left towers bad and far right towers very bad. However, I was very interested in the relationship between the JPEG preview histogram and making sure I get as much dynamic range in my raw files as possible. I like to shoot RAW plus JPEG with the JPEG image set to vivid and some of the settings plus upped. I now know the histogram will not accurately reflect my RAW images. If I set the JPEG settings to FLAT I may get close. How did I do?
Thanks for the great article. I can’t believe I’ve never used the color histogram before. Thank you, thank you, thank you.
It is an excellent tool, and not one that is necessarily obvious. Many cameras make you enable a setting buried in the menu if you are to use the color histograms, which requires you to know about it in the first place. Glad this article pointed you toward what you needed to know!
Nice article. I’d just like to mention a little feature on Nikons that might be handy at times. When the RGB histogram screen (not the overview with the single histogram) if you zoom in on the image with the + button, the histogram will change from the whole image to the area covered by the zoom. I don’t recall ever having needed it, but it seems kind of nice. On the overview, zooming switches to a full screen image.
Having used a D3200 for some time with unmetered manual lenses, I came to depend on the histogram as a post-shot exposure meter, and now though I don’t really need it so much the screen seems incomplete without it.
Hi Spencer,
I’ve been giving more thought to the idea of using histograms (to assist in achieving the best “appropriate” exposure) – and found myself circling around to the conclusion that they’re actually not of much real use at all ! (Unless the camera is on a tripod or I’m not using a modern mirrorless camera).
I should clarify my conclusion by saying that I enjoy the benefit of using a camera that has an electronic-viewfinder/EVF (such that I have a WYSIWYG view of the scene, *inclusive* of any exposure considerations, that I can see *before* I take the shot). Also, I’m using a camera which tends towards ISO-invariance; such that I have some leeway to “brighten” the captured image in post-processing – rather than needing to be absolutely sure to nail the required exposure in-camera, at the time of taking the shot.
Regardless of all that, the absolute key is always to capture as much light as possible, without over-exposing critical highlights – – and I don’t really see how checking the histogram helps with this (unless, of course, one doesn’t have an EVF that allows one to see the expected exposure *before* the shot is taken).
For example; say we find that the histogram looks like the first one in the article above (ie. skewed towards the left, reflecting the dark scene) … what is the photographer supposed to do about that?!
One solution might be to increase exposure by opening the aperture (smaller f-number) and/or to slow shutter-speed … However, neither of these adjustments might be acceptable or practical; as changing aperture may conflict with requirements for lens sharpness & depth-of-field; and slowing the shutter-speed, in an already dark situation, is likely to be a problem unless the camera is on a tripod.
Another (apparent) solution might be to increase ISO; either consciously or via the camera’s application of Auto-ISO. However, the result of this will actually be to reduce exposure to light from the scene (compensated by ISO-gain applied to artificially “brighten” an image captured with a shorter/slower shutter-speed) … and that’s definitely NOT the result one would ideally want.
In this case, applying information construed from the histogram is actually working against us !
So, when might a histogram truly be helpful? I can think of only two scenarios;
1) When the camera is on a tripod … so that I can slow shutter-speed to capture more light from a dark scene (and thereby move the histogram more to the right), while maintaining a low-ISO setting.
2) When I don’t have a camera with *pre-shot* exposure aids, such as highlighting in the EVF of over-exposed areas in the frame … such that my only option is to check the result of exposure *after* the shot is taken, and to adjust exposure accordingly (assuming that’s possible) on a trial-end-error basis.
Or, perhaps I have misunderstood something? (Genuine question – Not rhetorical).
I’ve turned my blinkies off because of what you have stated in the article. The blinkies do not represent what you can pull out of the highlights in a RAW file. I do watch the histogram with great caution though.
Hi Spencer
How do I get the uniWB file for the Nikon D610? And in what way is it installed?
Regards,
Carlos
Now I understand!!!
Thanks so much
great teacher!
Thank you Spencer for the informative and completely understandable article on Histograms and also thanks to all the commenters who have elaborated on the subject.
It occurs to me that this whole subject arises from the camera’s preview not showing the real exposure. For example from the article “Several times, I’ve taken pictures at night, and they look great on my camera’s LCD — until I open them the next day on my computer”. I would ask, why is that? Why does my DSLR preview do that?
My latest mirrorless camera, has a 3rd method for judging exposure, (in addition to the histogram and blinkies). There is an optional configuration setting that results in the the EVF showing how the final image is going to look. For example, If the image is going to be underexposed, the image in the EVF looks dark. And I can see the effect of changing the exposure right in the EVF. I find it to be a very useful tool.
Know a lot more then 15 minutes ago. Thank you for the help.
Thanks – heaps of them! – for this article, Spencer. For years, I’ve been seeing articles suggesting only halfwits do this – “good” photographers get everthing right in the first place. Any attempt to review what you’re up to is a sign of moral deficiency and photographic ineptitude. Because of my ancestry, I’m impervious to insult, so I just ignored it all and did my own thing. And the more of “my own thing” that I did, the less I need to “fix” anything later, in post processing. My conscience was salved – no need to drop by the church on Saturday afternoon, to explain myself to a higher authority.
Because I take rather more “available light” photos than most of the ‘togs I know, I do get into other problems. One which has been troubling me for a month or more relates to a shot that I insist on getting right, which seriously has an impossible stretch from dark to light. This morning, before seeing your article, I resolved to shoot a bracket and fix it in HDR. I’ve always shirked that before – but this time, I’m preparing to take the plunge – I seriously want to get that shot, and get it right, and get it with the available lighting, without resorting to flash or floods or any other paraphernalia.
Ignoring that one – over the past year or so, in conjunction with another group, I have been fooling around with a range of different post processing software systems. In the context of your article, there’s a huge amount of assistance available out there now, and it’s well worth exploring. Getting in behind the histogram in PP (that’s “post processing” – not some proprietary brand) can enable changes to the tonal range – and not just the composite tonal range, but also the ranges applicable to each colour (RGB) – which can help solve problems that defied solution using more conventional processing methods.
OOPS – that was an admission of failure – I should have read your article first, and got it right in the camera, before I even noticed I had such problems. :)