I guess today is a “blow your mind” Friday, because we have a guest post here by Iliah Borg, the person behind the RawDigger software that is used to analyze RAW images. I had a chance to engage in a conversation with Iliah when discussing the noise performance of the Nikon Df, where he not only proved me wrong on my assumption that the Df had exactly the same sensor as the D4 (turns out that they are similar, but not exactly the same), but also shared some incredible information about testing procedures, data analysis and other crazy, mind-boggling stuff! The learning curve with photography never ends, especially when you get into the whole sensor and image processing pipeline side of it. I must warn our readers though – the below article is very technical and is not intended for beginners! Hope you enjoy it! Nasim.
If one is shooting raw, they might be interested to know if there is any benefit in using intermediate ISO settings like ISO 125, 160, etc. There is no single answer to this question, because it depends on implementation of these intermediate ISO settings in the particular camera. Sometimes they are implemented the same way as the main ISO settings, but other times they are a result of certain manipulations, like digital multiplication.
To demonstrate how this can be determined, we will first analyze the so-called Masked Pixels (often called optically black area, or simply OB), which is a portion of the sensor that we normally do not see in our images. It is covered from light, so it can be a good indicator of the lowest possible noise of the sensor, while noise is what we analyze to learn how to use a given sensor optimally. We are taking a series of shots at varying ISO settings, from the lowest to the highest and, of course, using all intermediate ISO settings available. The subject of the shots can be anything – you can even shoot with a lens’ cap on.
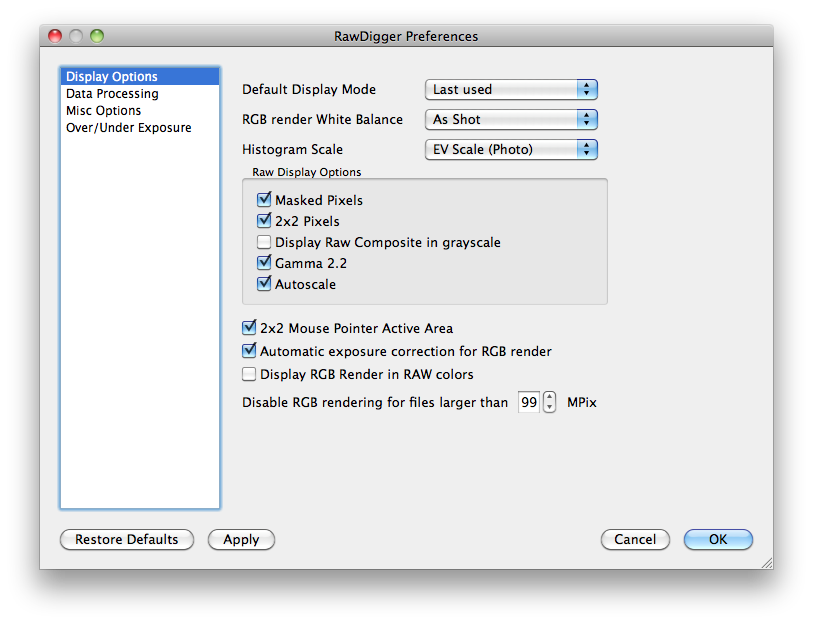
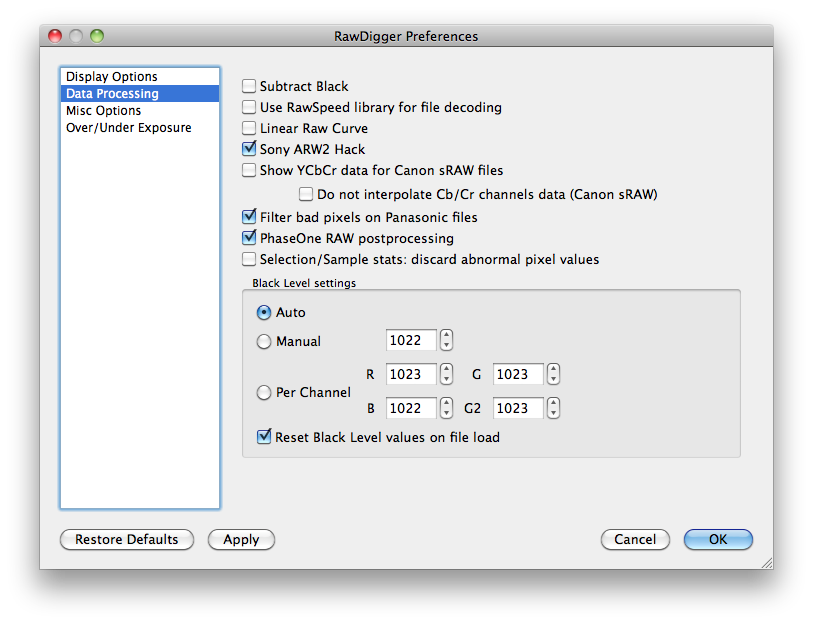
Next, bring the first shot of the series into RawDigger and set RawDigger preferences to display the black frame (Display Options, Masked Pixels checkbox, checked) and not to subtract black Level (Data Processing, Subtract Black checkbox, unchecked).
Here we have OB on the left side of the image. Using Selection/Set Selection by Numbers, select the masked pixels leaving several pixels out of selection on all four sides – because they can leak light or have technological imperfections.
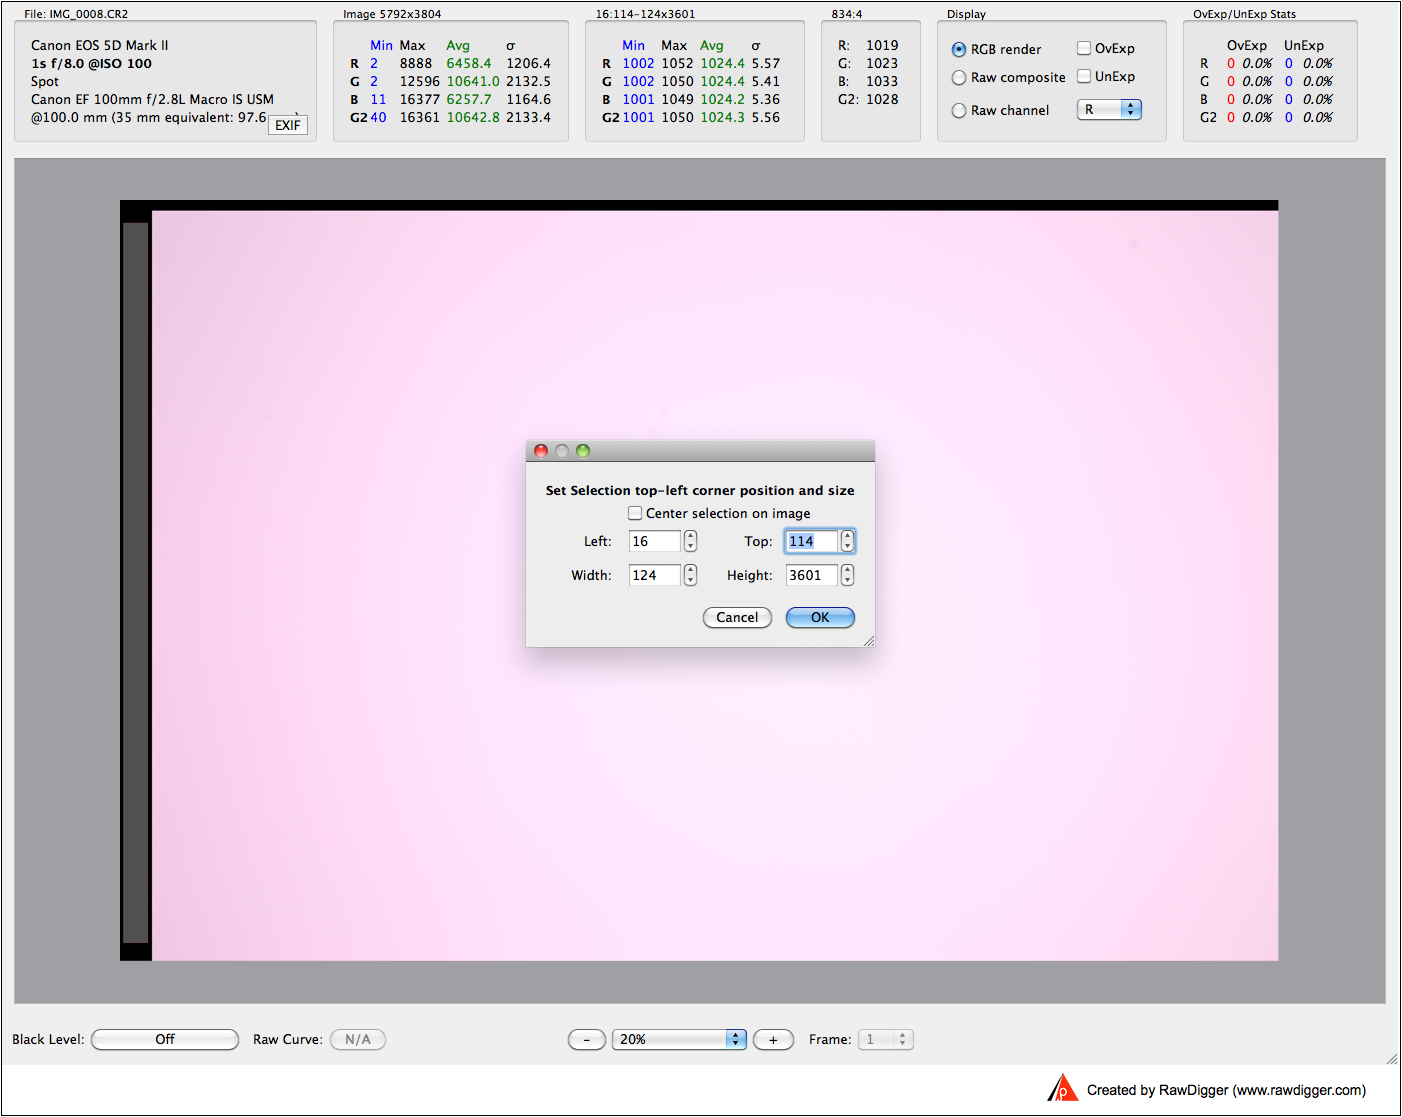
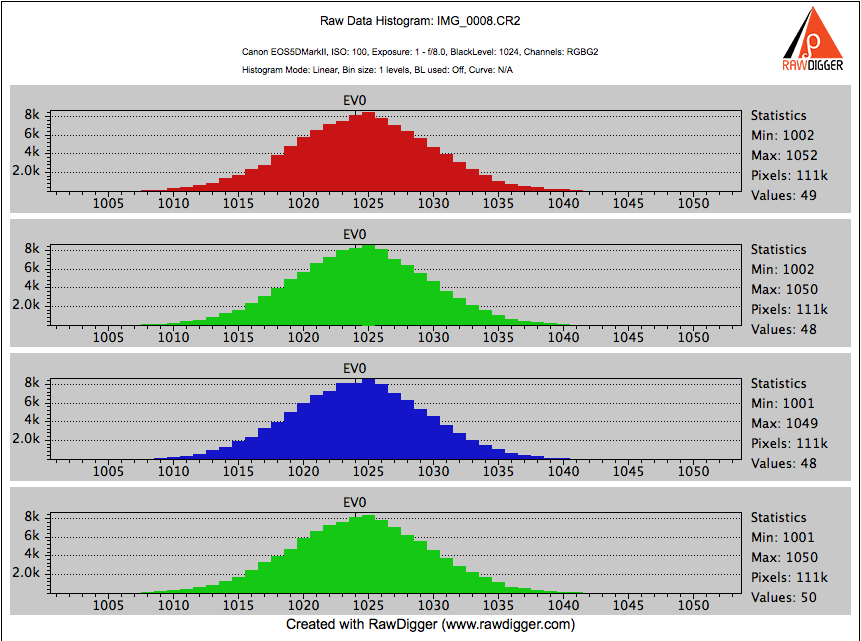
To check that the selection is valid, look at the histogram in Linear mode. If the histogram at all four channels closely resembles the bell-shaped curve, the selection is valid.
Convert the selection into sample (Selection/Convert Selection to Sample):
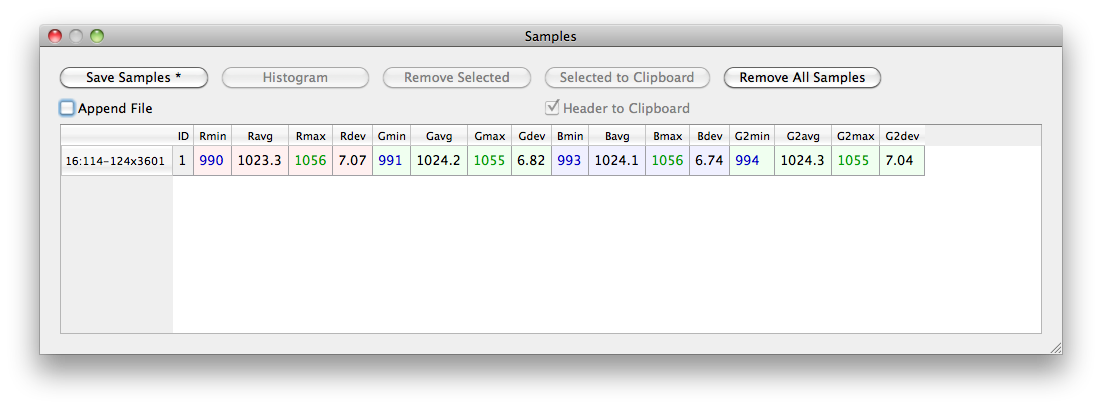
And save the data as a .csv file for future processing in a spreadsheet. Please set the checkboxes as per the screenshot below:

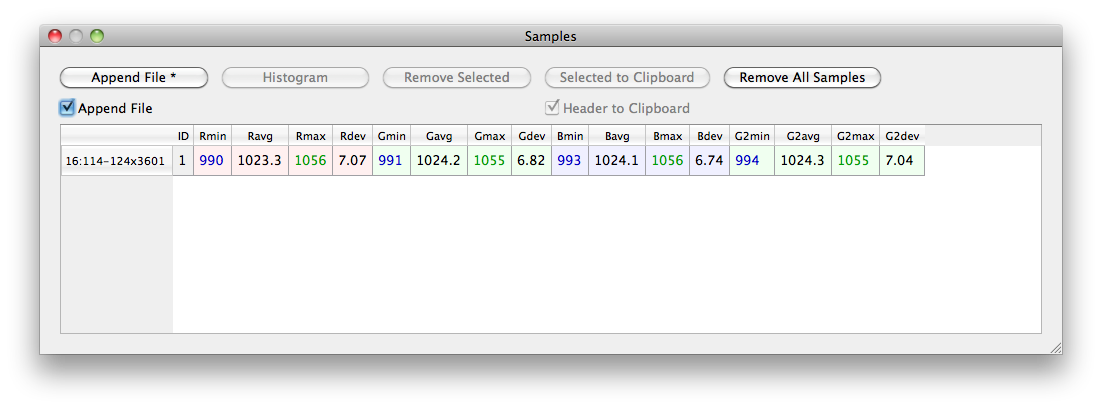
Open the next file and set the checkmark to Append File – to append the data to the already existing .csv file. Press “Append File”, the star mark to the right of the button name will disappear indicating the data is appended.
Process the rest of the series the same way.
Open the.csv file in a spreadsheet. Add ISO column and fill it with respective values. Now you can plot the noise against ISO settings; the noise values are in Standard Deviation columns Rdev, Gdev, Bdev, G2dev. For the Canon 5D Mark II camera the plot looks like this:
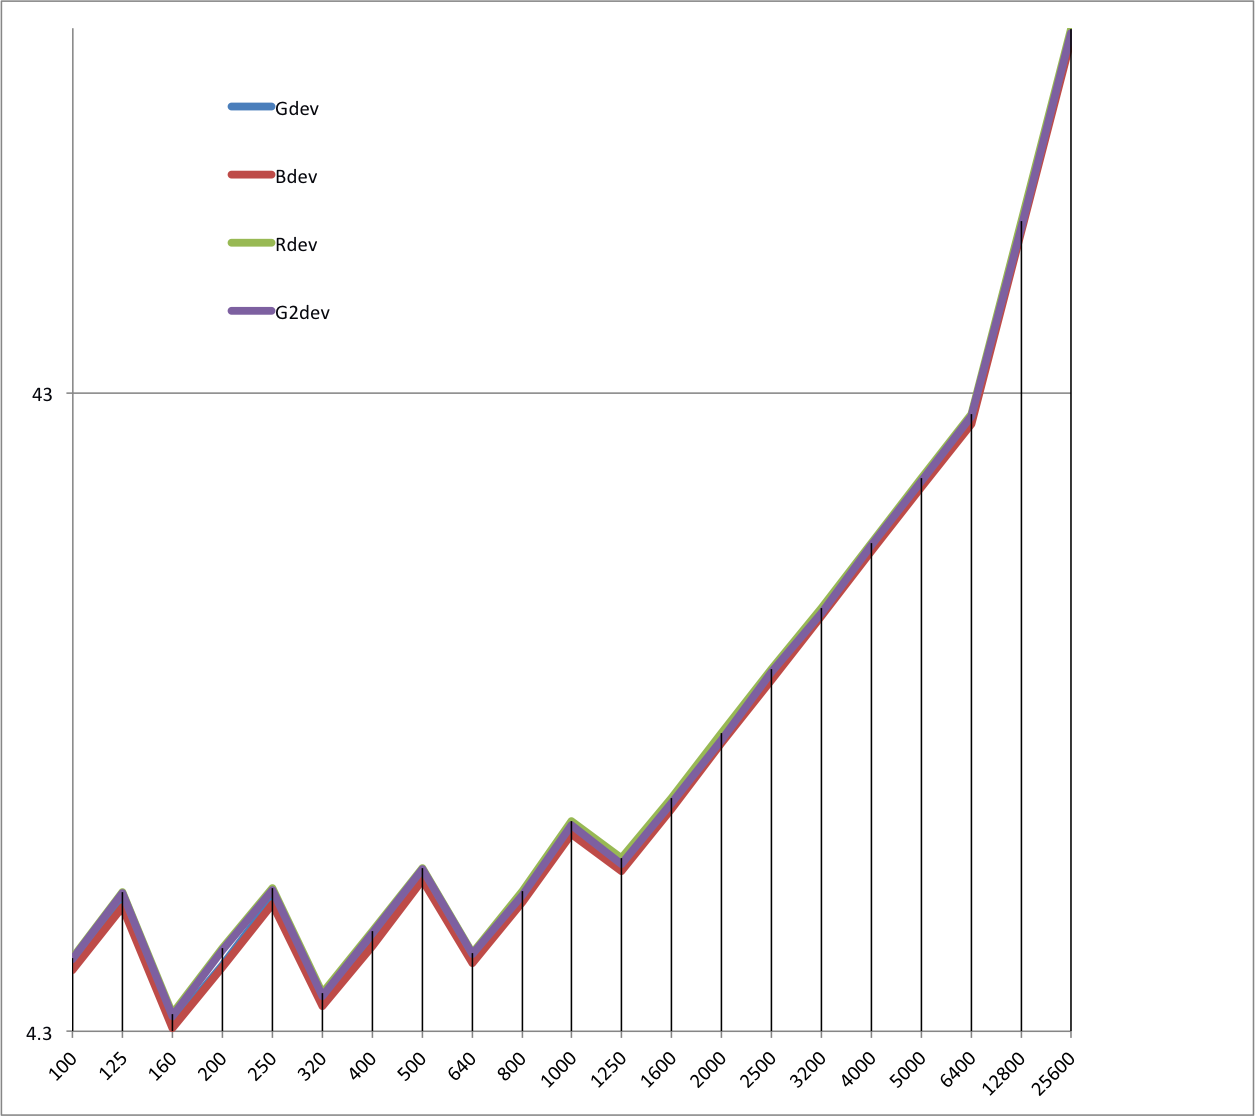
On this plot the X axis is ISO settings, the Y axis is noise on the logarithmic scale. You can see that the plots for all four channels are extremely close. The interesting part is the sawtooth between ISO 100 and ISO 1250. Contrary to expectations the noise at ISO 160 is the lowest while noise at ISO 125 is higher than at ISO 400. This is enough to suspect that something out of ordinary is going on. Lets do some additional calculations.
Dividing Gdev at ISO 125 (6.8361) by Gdev at ISO 100 (5.4293) we can see that the noise is increased by the factor of 1.26 (6.8361/5.4293 = 1.26). Incidentally 1/3 EV is equal to the cube root of 2 (21/3) = 1.26.
Lets look at the next slope formed by ISO 160 – ISO 200 – ISO 250. Dividing ISO 200 noise value by the noise value at ISO 160, the factor is 1.24. Dividing ISO 250 noise value by the noise value at ISO 200 we get the factor of 1.27. Meanwhile the noise values for ISO 100 and ISO 200 are very close. It means that here we have some additional stage to form the data values for intermediate ISO settings; they are not “native”. But are they of any use?
From just looking at the noise values one can deduce that the lowest noise value is at ISO 160. However it is not just the noise value that we are interested in. The characteristic we are looking for is the signal-to-noise ratio. For our case it is quite easy to demonstrate that not just noise at ISO 160 setting is lower, but the signal is lower too. We will see that in fact signal-to-noise ratio for ISO 160 and ISO 200 are essentially the same; especially if we are looking not just at the optically black area but at the image area as well, that is where some light is involved.
Lets set up a scene which consists of a black trap, essentially reflecting very little light back to the camera, and a small shining metal ball, which will be a source of specular highlights, causing the small portion of the sensor to reach its saturation maximum. There are plenty of advises over the Internet of how to make a black trap; we are using here a Datacolor Spyder 3D Cube, which is an extremely compact and useful exposure and white balance setting tool.
Place the camera on a tripod and shoot the cube on some matte background at the exact same shutter speed and aperture value, setting ISO 160 for one shot and ISO 200 for another. The shutter speed should be such as to assure a small hot spot on the metal ball.
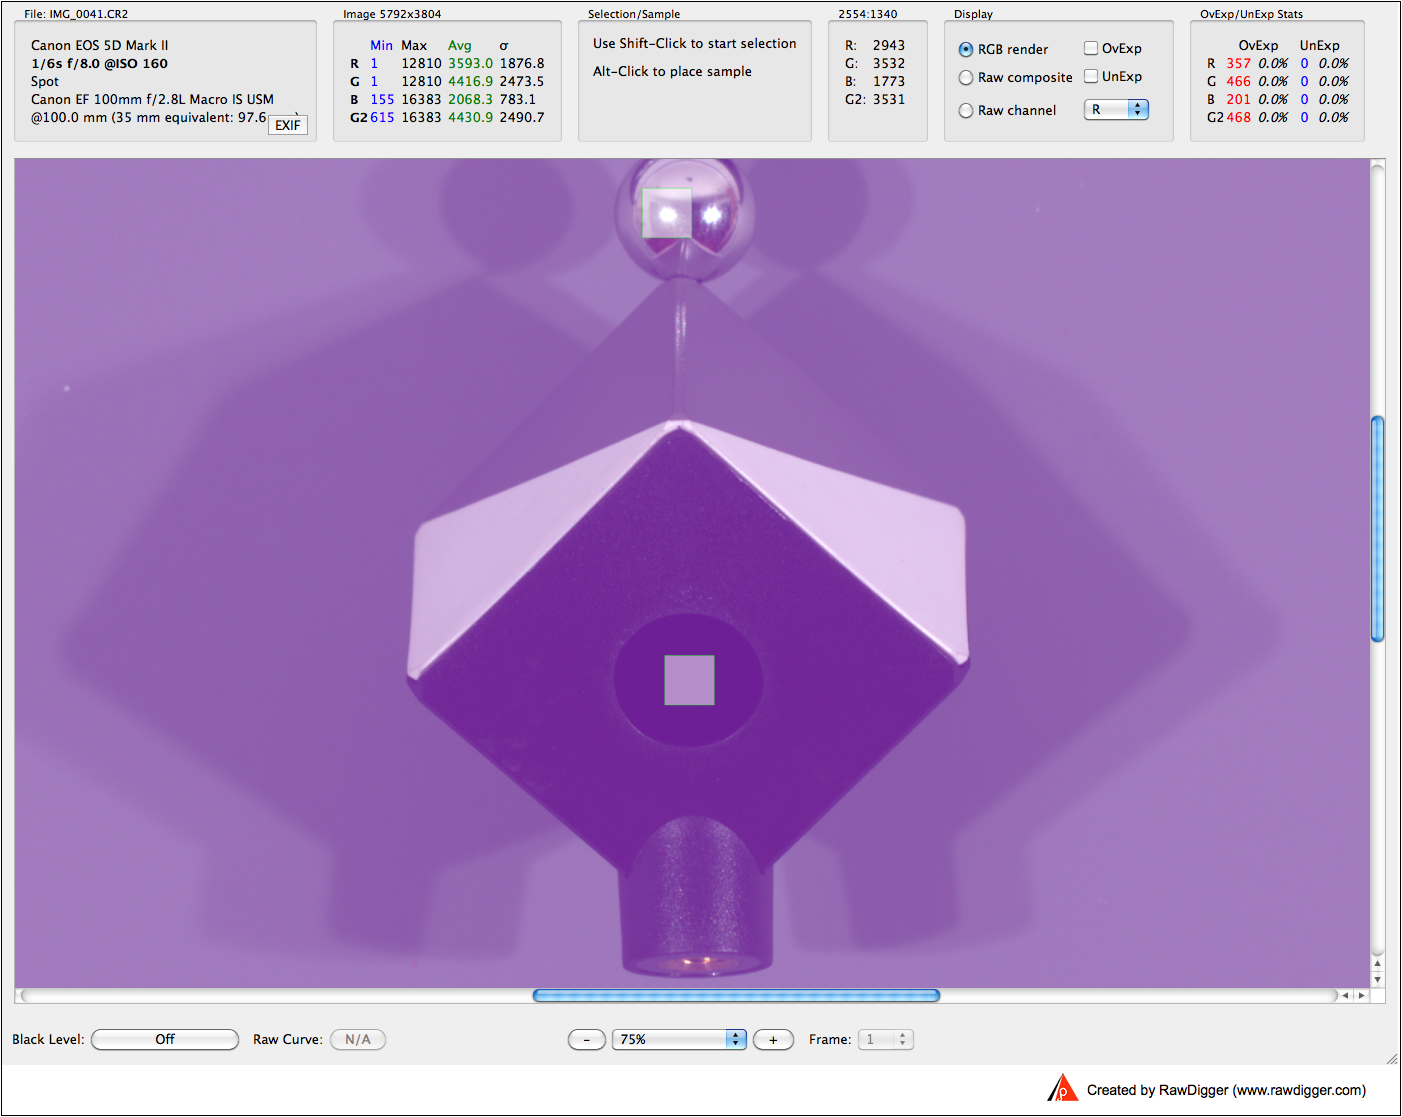
Testing exposure, bring shots to RawDigger, switch on Overexposure indication (OvExp) and see that you have one or two small red dots on the ball. On the image below you can see two red “eyes” on the ball. Those red areas indicate sensor saturation.

If you do not have those, re-shoot with a slower shutter speed and check in RawDigger now that there is some overexposure on the ball. Now you should have two shots, ISO 160 and ISO 200, taken with the same shutter speed you just determined and the same aperture value, which we are going to process in RawDigger. Lets place two samples on the first shot – one over the black trap and the other over the specular highlight:
You can change the Sampler Size in RawDigger preferences under miscellaneous options.

Next we save the samples to a .csv file:

Open the other shot. If there was no mechanical movement between the shots there is no need to adjust the position of sampling. Changing the mode by checking “Append File” appends the data. Now – to the spreadsheet.
Open the resulting .csv file in a spreadsheet and calculate the ratio of the saturation level to the noise:
- For the first shot the saturation is 12810, while the noise is 6.0901. The ratio is 2103.413737.
- For the second shot the saturation is higher 15760, and noise is also higher 7.334. Nevertheless the signal-to-noise ratio is slightly better (higher is better) and equal to 2149.071372.
The interesting part here, is that the ratio between the saturation at ISO 200 and ISO 160 is once again very close to 1/3 EV, that is 1.23. And this is the key to the riddle – for both ISO 200 and ISO 160 the sensor is run in the exact same mode, which is why the signal to noise ratio is practically the same. The exposure at ISO 160 is in fact the result of exposure at ISO 200, but shifted to the left by 1/3 EV, or in other words, divided by approximately 1.25. Yet another way to put it, is that noise-wise the result of an exposure at ISO 160 is equivalent to the exposure at ISO 200 with the shutter speed slowed by 1/3 EV or aperture opened 1/3 EV wider. Of course it appears from this that the headroom at highlights for ISO 160 is 1/3 EV less compared to ISO 200.
This suggests that though the noise at ISO 160 seems to be lower than noise at ISO 200, the signal-to-noise ratio is the same and there is no benefit of using ISO 160, at least if you shoot RAW.
You can repeat this simple analysis for other intermediate ISO settings, looking at signal-to-noise ratio and decide for yourself whether to use these intermediate ISO settings or not.
From the noise graph, it seems like the 1st intermediate value between the full EV steps are consistenly noisier than the 2nd intermediate value. I.e ISO125 is noisier than 160, ISO 250 noisier than 320, ISO 500 noisier than 640 and so on…
I would guess this is a global trend within the industry, and applies not just to the Nikon Df.
I’ve experienced this in the Olympus E-5 too.
So mabe one should stick to either the full stop EVs (100, 200, 400…) and/or the 2nd intermediate values between them (160, 320, 640…)?
I’ve been working with your marvellous RawDigger application and trying to repeat your experiment of graphing ISO against noise.
I was using my Sony RX1 for the experiment and I got an almost perfect straight line (R = 0.9996) by plotting ISO on the X-axis against noise (dev as calculated in RawDigger) on the Y-axis.
This puzzled me because you got a definite curve.
Regarding your graph, you state, “On this plot the X axis is ISO settings, the Y axis is noise on the logarithmic scale.”
I then inspected your graph more carefully and realised that you were not plotting ISO on a true linear scale. If you had been, the point at ISO 25600, for example, would need to be twice the distance from the origin as the point at ISO 12800, and so on. On your graph, it looks like each ISO point is equidistant from the preceding one. Now, that’s fine and illustrates your analysis very well.
But, it also appears that you plotted the ‘dev’ values in a straightforward linear—not logarithmic—fashion. That is, if the formula used to calculate dev is the usual standard deviation type formula?
Plotting a linear ISO (actual ISO values, like I did) with your curve should also straighten it— the sawtooth effect would still be present but would not be as obvious.
I then plotted the log to the base 10 of my ISO values (although any base would give a similar shaped curve) against dev and, lo and behold, I got a curve very similar to yours.
All my channels, like yours, were extremely close, but I didn’t get a dramatic sawtooth effect at lower values.
Thank you for reawakening my interest in mathematics as well as in digital photography!
Thanks for testing this on the RX1. I can assume the ADC designs are similar on the other Sony sensors, and thus I don’t need to get hot and bothered that the ISO’s counted in 0.3EV steps on my A7II, as I would have to with a Canon camera.
Hi,
I know that this is kind of a old thread and article but is it possible to get similar curve out of a7(r) -files or does the Sony compression algorithm ruin the results?
It would be interesting to compare Sony’s results against Nikon’s.
Dear Matti,
Yes, it is possible – all you need is the camera and a free trial of RawDigger.
Yes, I just upgraded my license to Research Edition and followed the intructions above. I got more or less straight line (logarithmic) from ISO 200 to ISO 12800 using a7r RAW’s from dpreview. There is slight bend in 1600 but not like with D800E (which I own).
So the compression does not affect the end result in this case?
Dear Roland,
If you know that, why ISO 160 instead of ISO 200?
I think it really depends on what is more important to you. If you want less noise in the shadows, definitely use these intermediate ISOs on the Canon 5D (ii or iii). This is what I want, so I use ISO 160, 320, 640 and 1250 (as the plot shows, above that the noise advantage stops). However, this comes at a loss in highlight recovery of the same amount (1/3 EV), because the dynamic range of the sensor is fixed. So if you need that headroom in the highlights rather than in the shadows, definitely go for the main ISOs of 100, 200, 400 and 800.
Dear Roland,
> If you want less noise in the shadows, definitely use these intermediate ISOs
Sorry but it is not correct. The lower absolute noise comes with lower maximum, so in effect it is just a pulled down shot.
Sorry, but when pushing exposure in the shadows, I definitely see considerably less noise at ISO 160 than at ISO 100. As I said, this comes at reduced highlight recovery options, but this trade-off is one I am willing to take. I don’t see this with my Nikon cameras, since they handle ISOs in a different way, but on my 5D iii, I see significantly less banding noise in the shadows when shooting at those intermediate ISOs.
Dear Roland,
> I definitely see considerably less noise at ISO 160 than at ISO 100.
Why ISO 100? ISO 160 is to be compared to ISO 200 (which it is). No wonder, Canons often do not have least banding at the lowest ISO settings.
Exactly.
I guess one usually assumes that the lowest native ISO (ISO I00) should have the least shadow noise, which is true for the latest great Nikon sensors (like the ones in the D4 or D800(E)), but unfortunately not for the 5D sensors.
I hope the 5D iv will finally feature a next generation sensor that has DR and noise characteristics similar to the D800(E) sensor…
Because when you shoot at ISO 160 and increase the exposure value by 1/3 stop (i.e longer shutter or wider aperture) you are increasing signal by 1/3 stop while leaving noise constant.
> Because when you shoot at ISO 160 and increase the exposure value
I guess you mean the increase compared to ISO 200 setting, right?
Depends on the camera. We were looking here at 5D Mark II. For this camera, ISO 160 is obtained through setting the amplifier (PGA) to ISO 200 and digital division of the raw data by 1.25; maximum values are about 11800. You can look at it this way, highlight headroom is reduced by 1/3 EV, while shadows are 1/3 stop lifted. It is simpler to set +1/3 EV on the camera at ISO 200, and avoid digital channel stretch.
We face challenges all day, I will work on all I av gain from the experience .
I’m a former film photographer too, but as a wedding photographer I find it useful to set the camera to whole stop adjustments anyway: I can walk out of a dark church to the outside and quickly change in just two or three clicks.
Dear John,
It is not a given that whole stops are the best choice from the noise standpoint.
—
Best regards,
Iliah
I appreciate that Iliah, but that is not why I use whole stops.
I was not expecting that…
Dear Nikolay,
Excellent work. Yes, lower ISO values are just exposure meter shift, with the same analogue gain; same, after ISO 1600 the analogue gain is fixed while an additional digital multiplication stage is used before writing the raw data. Intermediate ISO values between ISO 100 setting and ISO 1600 setting are obtained through “honest” analogue amplification.
—
Best regards,
Iliah
Wonderful article though it did make my mind hurt a little.. :)
Will definitely pick up this piece of software to explore this further…
Thanks…
Nikon D800 is a bit unexpected. Seems that the SIO range is from 100-1600
I have to study this. I’d like it if someone said “Use your ISO settings just like film: 100, 200, 200, 800 etc … (K64 of course is 100ISO). Skip the others. This may explain why there are a few well-known landscape shooters who shoot a lot at 160 on the Canon 5D … less noise than ISO100. Hmmm. I wish he’d done this for the D800. (still reading…)
WAIT! Stop the presses! He says at the end, “This suggests that though the noise at ISO 160 seems to be lower than noise at ISO 200, the signal-to-noise ratio is the same and there is no benefit of using ISO 160, at least if you shoot RAW.” There you have it. I’m sticking with ISO100, 200, 400 etc. The shutter speed/f-stop inverse ratios are too deeply embedded in my brain.
Thank God for people like this who study and report these things. I would never do it, even if I had the math/statistic skills. I’m just a button pusher! I appreciate their efforts tremendously. Thanks.
Dear Patrick,
Nikon is a different story. I do not have D800 available for test, but you can try yourself. I can do a Df if anybody is interested.
—
Best regards,
Iliah
I’m searching for my slide rule now :)
Dear Patrick,
Set the camera to lossless compressed, close the lens with a cap, close the viewfinder, set the exposure to 1/8000, close the aperture to its minimum, shoot at each ISO including intermediate.
Open the first shot in RawDigger, set Preferences to make Masked Pixels visible, using select by numbers do a selection like this:
Convert selection to sample, save the data as csv, open the next file and append data. Repeat for all the files in this series. Plot the Gdev, or put the resulting csv online so that I can make a plot.
I’ll try … soon. Thanks! PD