After extensive tests, Photography Life has determined that we can measure Canon RF and Sony E lenses in the lab while producing comparable sharpness charts to our existing Nikon Z and Nikon F lens tests. The article below explains the lab tests and normalization factor that Photography Life uses in order to achieve comparable Imatest numbers across brands.
Table of Contents
Background
In the early years of lens testing at Photography Life, every lens was measured on the 36-megapixel Nikon D810. When the Nikon D850 was announced, our lens testing lab began using it instead due to the 45 megapixel sensor.
When Nikon introduced the mirrorless Z system, our team confirmed that the Imatest numbers from the Nikon D850 are equivalent to Imatest numbers from the 45 megapixel Nikon Z7, including for adapted F-mount lenses. Since then, we have used the same Nikon Z7 body in the lab when testing all of our Nikon lenses, both F mount and Z mount. Thus, all lens tests we run are fully comparable to one another within the Nikon brand. However, we have increasingly been interested in testing non-Nikon lenses in our effort to be the most complete lens review website online.
The resolving power test performed at Photography Life is Imatest SFRPlus with LW/PH MTF50 measurements on our 7-foot Imatest chart. This test measures line widths per picture height. Line widths refer to the distance between two adjacent clearly-resolved black lines. This figure describes the total resolving power of a particular camera and lens system. It can also be converted into line pairs per millimeter measurements by dividing LW/PH MTF50 numbers by the width of the camera sensor in millimeters. For example, if a particular camera and lens combination scores 4000 in our charts, it signifies that the particular lens could resolve up to 4000 black lines across the width of the particular sensor (if that area of the frame were extrapolated across the entire image). Thus, the measurement is dependent upon lens resolving power, sensor resolution, sensor width, and other factors such as the sensor’s anti-aliasing filter strength.
All of this makes it very difficult to compare lenses on even footing across camera brands. The exact same lens tested on camera sensors with different resolutions, sensor sizes, and on-sensor filtration will result in different LW/PH MTF50 measurements. This is why we historically have tested lenses in Imatest only on the Nikon D850 and Nikon Z7 (apart from the older tests on the Nikon D810), allowing all the charts on Photography Life to be comparable, but limiting us just to the Nikon brand.
To be blunt, there is no perfect way to get lens test numbers from one camera brand to match numbers from another brand. However, photographers often like to compare lenses across brands regardless, especially if they are thinking about future use of these lenses. For example, which company’s 35mm f/1.8 will still hold up on the camera sensors of the future, which may have more megapixels or sensor-shift technologies to capture even higher resolution? The highest resolution camera today might be a Sony; tomorrow a Canon; the following day a Nikon. But a given lens may be used indefinitely.
For that reason, we find it essential to test Sony and Canon lenses such that they can be compared accurately against our existing lens reviews of Nikon F and Nikon Z lenses. This is done through the use of a multiplication factor that translates LW/PH results from Canon and Sony into figures that are directly comparable to our existing Nikon results. In other words, the Canon and Sony lens test results shown in charts on Photography Life do not display LW/PH MTF50 results directly (unlike Nikon results), but rather, they display what the LW/PH MTF50 results would have been had the lens been tested on a 45.7 megapixel sensor comparable to that of the D850 and Z7.
Why not test Canon and Sony lenses directly on Nikon’s sensor, then? One issue is that some lenses cannot be adapted to Nikon Z using any available adapters, for example, there is no adapter to use Canon RF lenses on Nikon Z cameras. A second issue is that mirrorless lenses tend to achieve maximum resolving power on cameras of their own brand, especially in the corners, while losing significant resolving power in the corners when adapted to other brands. As a result, adapting Sony FE lenses to the Nikon Z7 for MTF50 tests would yield accurate numbers in the central region, but midframes and corners would show low numbers that would not accurately reflect the quality of the lens.
This is why each lens must be tested on its own brand of camera, and a multiplication factor must be applied to correct innate sensor-based differences if comparable numbers are to be achieved across brands.
The Tests
Our method was to test the same copy of a particular lens on three separate cameras – one Canon camera, one Sony camera, and the Nikon Z7 – and calculate how the LW/PH MTF50 numbers differ. This would be repeated with additional lenses for confirmation, in hopes that the differences among the three cameras would be consistent regardless of lens. If so, a multiplication factor could be calculated to compensate for the innate differences between the Canon, Sony, and Nikon sensors, and it could be applied to future lens tests confidently.
We ran Photography Life’s usual LW/PH MTF50 test on the following eight setups:
- Sigma 40mm f/1.4 Art (F-mount) on Nikon Z7 with Nikon’s FTZ adapter
- Sigma 40mm f/1.4 Art (F-mount) on Canon EOS R5 with the Novoflex Nikon F to Canon RF adapter
- Sigma 40mm f/1.4 Art (F-mount) on Sony a7R IIIA with the Monster Nikon F to Sony E adapter
- Canon EF 35mm f/1.4L II on Canon EOS R5 with Canon’s EF-EOS R adapter
- Canon EF 35mm f/1.4L II on Nikon Z7 with the Fringer Canon EF to Nikon Z adapter
- Canon EF 35mm f/1.4L II on Sony a7R IIIA with the Metabones Canon EF to Sony E adapter
- Sony 50mm f/1.2 GM on Sony a7R IIIA
- Sony 50mm f/1.2 GM on Nikon Z7 with the Megadap Sony E to Nikon Z adapter
Since there is no Sony E to Canon RF adapter, a third test could not be performed on the Sony 50mm f/1.2 GM.
Note that the seven adapters used for this test are “hollow” meaning that they don’t introduce glass elements of their own to the optical path. No single company makes all the necessary adapters, so the adapters for this test were chosen for their availability on the market.
The three lenses were chosen because of their reputations for exceptional sharpness, which they lived up to. The intent was to collect data from the highest peaks of sharpness to the lowest measurements at f/16 in order to have as much information as possible when creating multiplication factors among the three cameras.
As for the cameras, these three were chosen because of their similar resolutions. The Canon EOS R5 has a 45.0 megapixel sensor; the Sony a7R IIIA has a 42.4 megapixel sensor; the Nikon Z7 has a 45.7 megapixel sensor. This similarity alone does not mean that the Canon and Sony Imatest numbers would match our existing Nikon test results, however. Many differences remain: differences in sensor design, filter stack, and image processing, among others. The Canon EOS R5, for example, has a weak anti-aliasing filter, while the other two cameras have none. Thus, despite the similar sensor resolutions, a multiplication factor was still required in order to achieve comparable numbers.
Test 1: Sony 50mm f/1.2 GM
Our first test was to find the LW/PH values of the Sony 50mm f/1.2 GM on the native a7R IIIA and adapted to the Nikon Z7. It was not possible to test this lens on the Canon EOS R5 because there is no Sony E to Canon RF adapter.
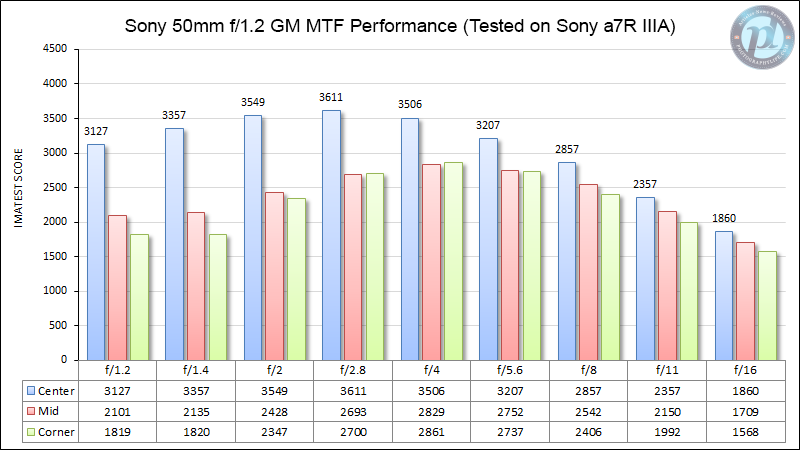
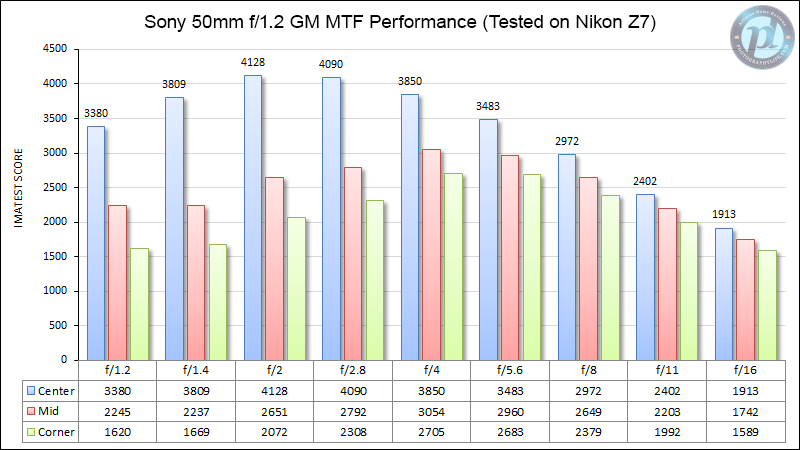
There are two points to take away:
- The highest value measured occurs on the Nikon Z7 in the center. This is a logical result, since adapters do not substantially impact sharpness in the center of an image, and the Nikon Z7 is capable of higher maximum LW/PH MTF50 numbers than the a7R IIIA due to small differences in sensor resolution, sensor size, processing, and other sensor design differences.
- Corner measurements are higher on the a7R IIIA than on the Z7. This is also a logical result, considering the aforementioned issues with adapting mirrorless lenses across different camera brands.
Thus, when assembling the data to calculate a multiplication factor between Sony and Nikon, we only included the central MTF50 numbers of the Sony 50mm f/1.2 GM and did not include the midframe or corner numbers from this lens.
Test 2: Canon EF 35mm f/1.4L II
Due to the much longer flange distance of DSLRs, light from DSLR lenses hits camera sensors at a more direct angle, and adapting them to mirrorless does not cause the same corner sharpness issues discussed above. With that in mind, here are the results for the Canon EF 35mm f/1.4L II tested on all three cameras:
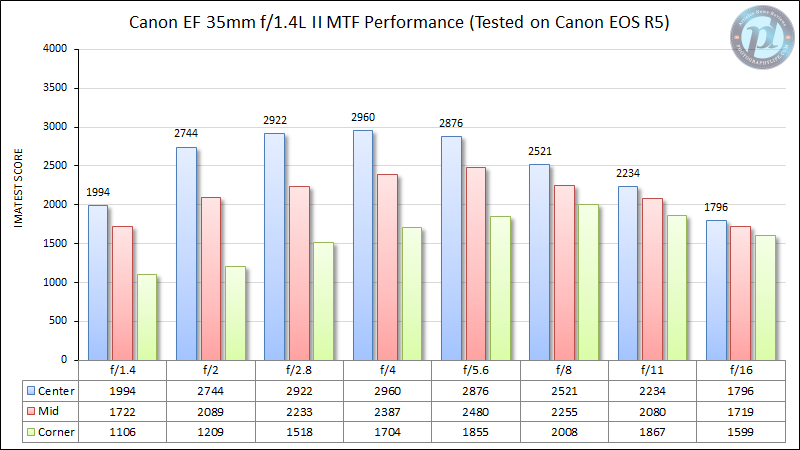
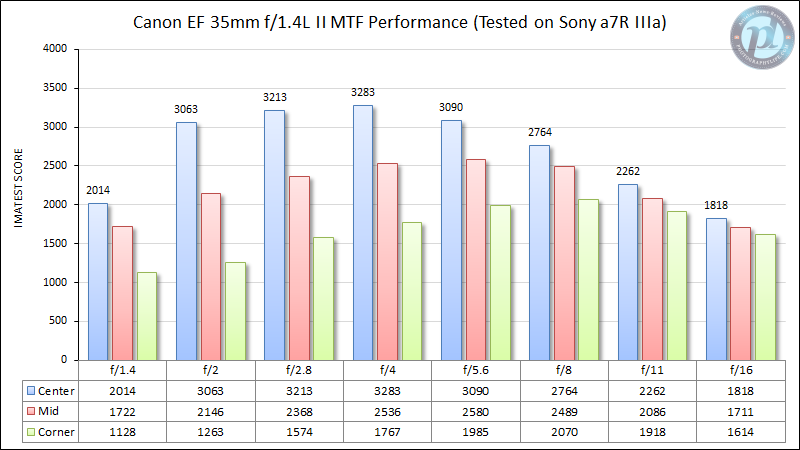
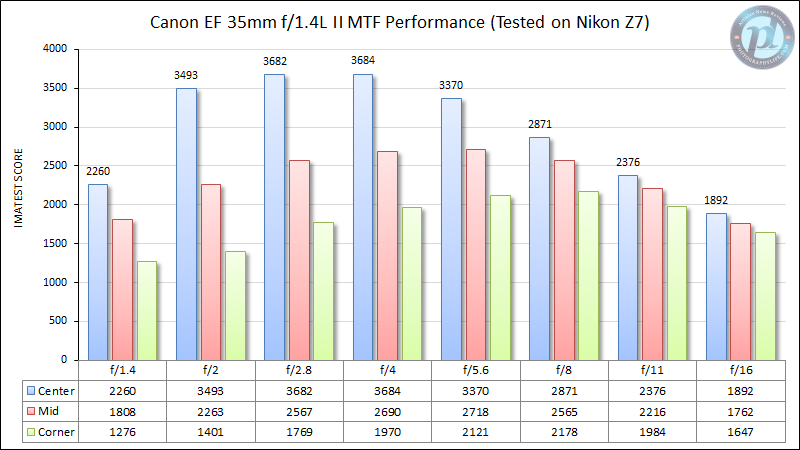
There are three points to take away:
- The pattern of results is extremely similar in all three tests (i.e., the relative sharpness of center, midframe, and corners), demonstrating that adapter-related corner sharpness issues are not present to a significant degree this time.
- Measured MTF50 numbers are highest on the Nikon Z7. Numbers on the Sony a7R IIIA are next highest, while numbers on the Canon EOS R5 are the lowest. This is not surprising considering that the EOS R5 is the only one of these three cameras with an anti-aliasing filter.
- Differences across cameras are substantial at the sharpest apertures, while differences across cameras in less sharp regions (like f/16) are much smaller.
Based upon these results, we included all three areas of the frame – center, midframes, and corners – in our calculations of the multiplication factors from the Canon 35mm f/1.4L II.
Test 3: Sigma 40mm f/1.4 Art
This test unfolded the same as with the Canon EF 35mm f/1.4L II, since the Sigma 40mm f/1.4 Art is also a DSLR-designed lens. As with the Canon, we were able to use center, midframe, and corner MTF50 figures in our calculation of the multiplication factors.
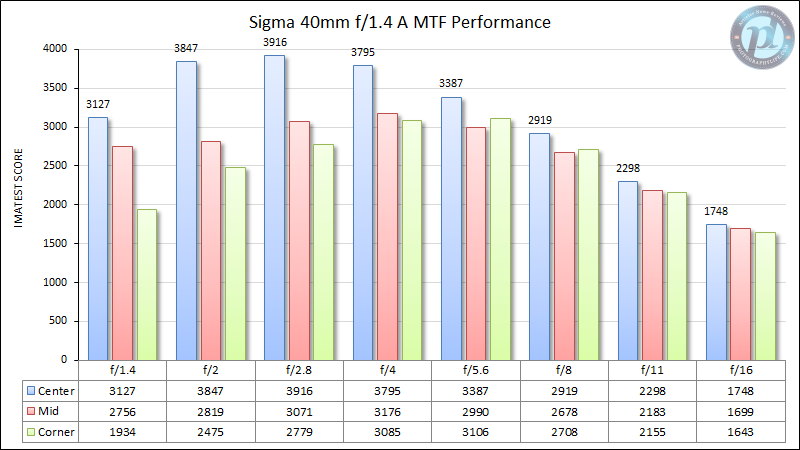
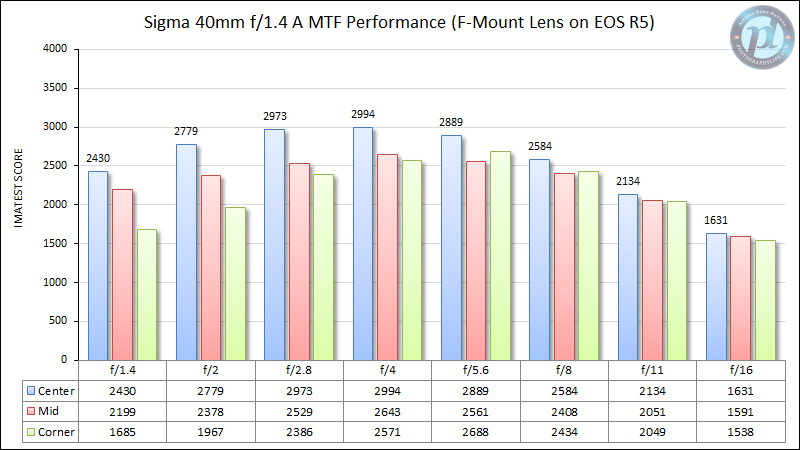
The adapter used to test the Sigma 40mm f/1.4 Art on the Sony a7R IIIA broke partway through the test and would not allow testing at wider aperture values. Thus, only narrow aperture results from that test were incorporated into our data analysis to determine the multiplication factors.
Otherwise, all three takeaways discussed under the Canon EF 35mm f/1.4L II apply to the Sigma 40mm f/1.4 Art as well.
Data Analysis: Canon to Nikon
The data were graphed to compare the same lens’s scores on each camera. For each data point, the y-value is the Nikon measurement and the x-value is either the Canon or the Sony measurement. For example, when graphing the “Canon to Nikon” values, one data point was (1994, 2260), which are the two values for central performance at f/1.4 on the Canon EF 35mm f/1.4L II, as measured on the R5 and Z7 respectively. This process was followed for every measurement and graphed below.
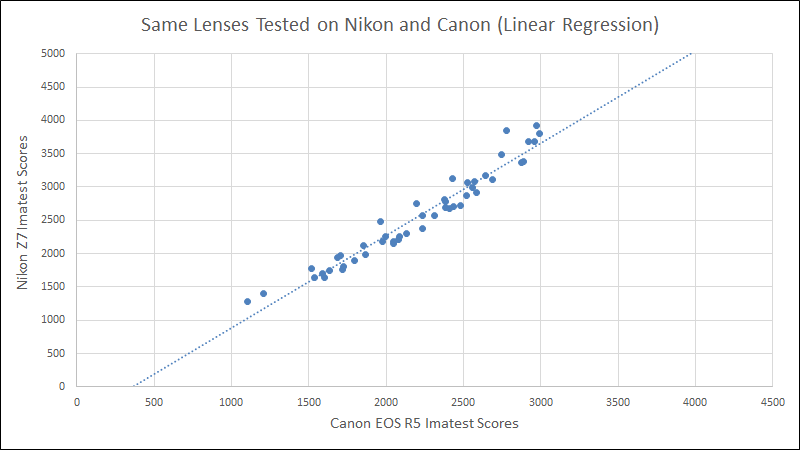
The results above show a very tight grouping. LW/PH values on the Canon EOS R5 are strongly correlated to LW/PH values on the Nikon Z7. However, the simple linear regression shown above is not the optimal fit. One major issue is that the point (0,0) is not on the line. If a very blurry lens is ever tested on the Canon EOS R system (for example, a Lensbaby with deliberately blurry corners that measure under 300 LW/PH), the linear regression would recommend negative values when converting the numbers to Nikon Z.
One attempt to fix this issue is to lock the line’s y-intercept at zero. However, this leads to an inaccurate line of best fit:
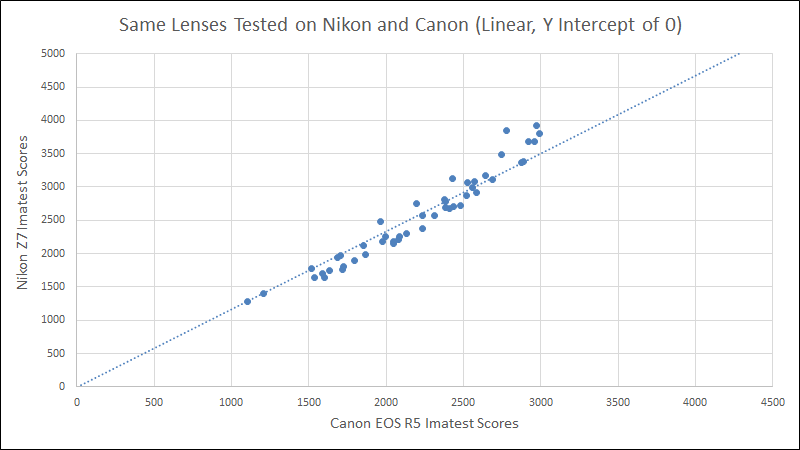
In particular, the line of best fit above is substantially underestimating the higher values. Under this multiplication factor, no Canon lens would ever approach the sharpest Nikon or Sony lenses and would max out around 3400 LW/PH. This is simply not true of Canon lenses in practice; for just one example, our test above on the Z7 already showed that the EF 35mm f/1.4L II is sharper than that.
Our conclusion is that the trend between the two sensors is not linear. Instead, as a lens becomes sharper, the difference between the two sensors increasingly diverges. For example, a test result of 2700 on the EOS R5 is roughly equivalent to 3400 on the Nikon Z7, but a test result of 1700 on the EOS R5 is roughly equivalent to 1800 on the Nikon Z7.
So, instead of a linear regression, we next examined a polynomial regression in the form y = ax2 + bx. In order to keep the y-intercept at zero, we did not add a constant, c. That result is as follows:
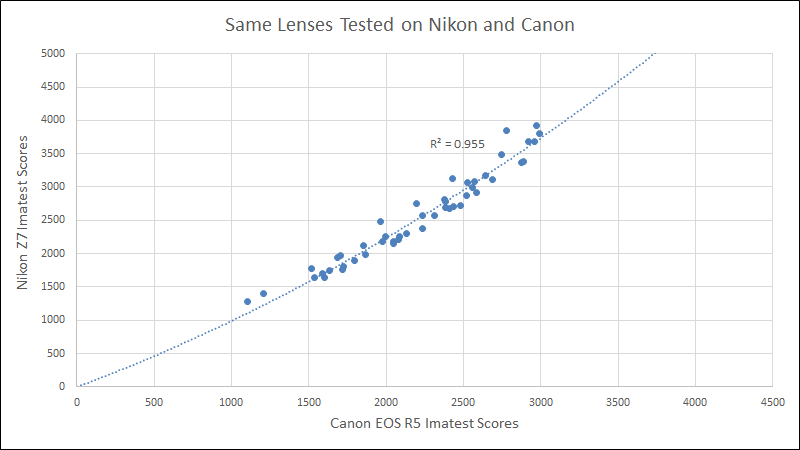
While there is no perfect line of best fit for this data, the polynomial regression above is a very close fit. Note that Photography Life is not making the claim that the relationship between these numbers is definitely a second-order polynomial relationship rather than, for example, a third-order or exponential relationship – or linear at the lower values and something else at the higher values. Rather than investigating the full origins of the curve, our goal was to produce a simple curve that is consistently predictive in the range of Imatest values from roughly 1000 to 4000 that we see in typical lenses under review. The regression above clearly succeeds at that goal.
Data Analysis: Sony to Nikon
The results from the Sony a7R IIIA and the Nikon Z7 were graphed in the same manner, and a second-order polynomial regression was calculated again.
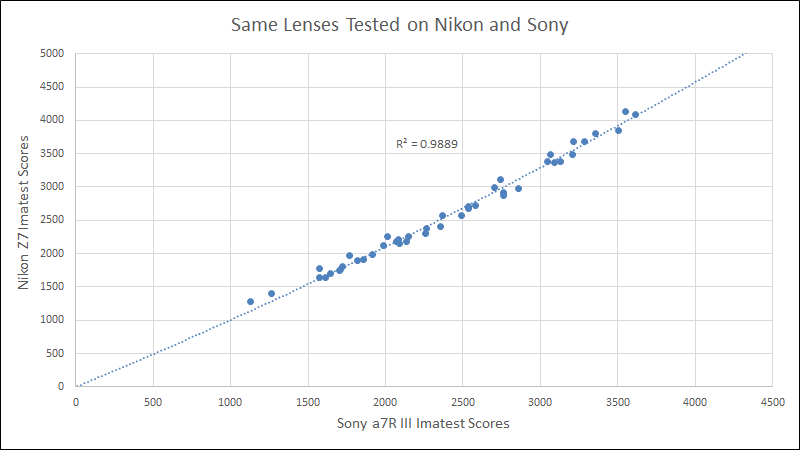
The regression above is an extremely close fit. As such, it can be applied to test results from lenses on the Sony a7R IIIA in order to achieve comparable figures to those of our existing lens reviews on Photography Life.
Conclusion
Our Nikon lens reviews on Photography Life have always had comparable figures, allowing photographers to compare the resolving power of different lenses even across Nikon Z and Nikon F mounts. After the tests above, the same can be said of all Sony and Canon lens reviews on Photography Life, too.
The two polynomial regressions shown above are applied to all Sony and Canon lens test results shown on Photography Life so as to match our existing Nikon Z and Nikon F charts. In short, photographers who rely upon Photography Life’s lens reviews can compare lenses across brands with a high degree of confidence, whether the reviewed lens is a Canon, Sony, Nikon, or third-party optic.
You do such interesting work with these tests! I confess I’m a little obsessed with the reviews as I decide what lenses to have in my kit.
One thing I often wonder about is how to interpret the raw numbers for real-world purposes. If you ever decide to write an article discussing how you think about this issue I think it would be fascinating. I’m always tempted to want the best, to dream about what could be done with one of these ultimate lenses, but of course it costs, and as a hiker I also think about weight. What do I really get in IQ if I go from Z 70-180 to z 70-200, carrying a pound and a half? Am I even going to notice the difference (assuming I’m using the lens properly, of course!)
I am no testing expert, so my thinking on this is pretty simplistic. Where my mind goes is: I’d like to see some real world images (not brick walls…?) shot with different lenses with established scores, then compare the results. What difference does it make to go from 1500 to 2000 or 2500 in the corner? What do you get when the center sharpens from 2500 to 3000, 3500, even, gulp, 4000? This is probably naive; I wonder how the writers, who are a lot more sophisticated, think about it. I bet I’m not the only one who struggles with this and would be very interested in your thoughts.